


Boredom of Students in the Learning Environment of Bulgarian’s Junior High School
Автор: Герджикова Нина Димитрова
Рубрика: Общеобразовательная школа
Опубликовано в Образование и воспитание №2 (7) апрель 2016 г.
Дата публикации: 15.03.2016
Статья просмотрена: 28 раз
Библиографическое описание:
Герджикова, Нина Димитрова. Boredom of Students in the Learning Environment of Bulgarian’s Junior High School / Нина Димитрова Герджикова. — Текст : непосредственный // Образование и воспитание. — 2016. — № 2 (7). — С. 34-37. — URL: https://moluch.ru/th/4/archive/29/824/ (дата обращения: 27.07.2024).
BoredomofStudentsintheLearningEnvironmentofBulgarian’sJuniorHighSchool
Ключевые слова: эмоция, опыт, скучать.
During the last 25 years, Bulgarian school is under unceasing political and social pressure to change. The current emphasis on school reform makes many demands on the outcomes of students in each age level of junior high school, which includes grades from fifth to eighth.
According to the report of data from TALIS(The OECD Teaching and Learning International Survey), conducted in Bulgaria in 2013, from 65 % to 87 % of the time during the classes is used for learning and instruction and about 5 %-20 % for maintaining order and discipline [2,c. 22]. Another report on both, the reading and mathematical literacy of students from sixth grade had indicated that cognitive processes, domain knowledge and skills, only, are important. [2, c. 12,29]. Motivation and attitudes are defined similarly by the variable as “understanding of information” within the text or drawn upon outside knowledge [1,c.67].
These results confirm the neglecting the issue of the emotional experience of students as the reason for the various achievements. Pekrun, Goetz&Perry [7] try to overcome this disadvantage in educational theory and practice by creating “The Achievement Emotions Questionnaire». The authors define it as “a multidimensional self-report instrument designed to assess college students’ achievement emotions” [7,c.3] They choose for a framework the component process’s model for emotions, developed by Scherer. In addition, they view emotions “as sets of interrelated psychological processes, including affective, cognitive, physiological, and motivational components” [7,c.4] Data on class-related boredom were obtained from students aged between 12 and 15 years. The survey involved 343 students. They have to assess eleven statements. At the beginning of the questionnaire, they received the exact instruction: «The fllowing questions pertain to feelings you may experience DURING class. Please indicate how you feel, typically, during class in …».. [7,c.7] Here, in place of dots, the respondents had to identify one of the school subjects. Pekrun, Frenzel, Goetz&Perry considered their control-value theory of achievement emotions as an integrative approach to emotions in education [5,c.13] They give some arguments in support of their theory:
different emotions are characterized by distinct appraisal determinants;
all emotions can be described by common, underling dimensions like valence and activation;
the affective impact of social environments is mediated by control and value appraisals [5,c.24].
As a result of these considerations, the authors think that boredom is induced, “if the activity lacks any incentive value (positive or negative)”; furthermore, it could be caused by low and high-demand conditions [5, c.21]. In another study, Pekrun, Goetz, Daniels, Stupnisky&Perry categorize boredom “as a negative, deactivating emotion, because it is experienced as unpleasant and involves a reduction of physiological activation” [6,c. 532]. They think that the emotional experience of boredom can be explained contradictory. In this sense activation of peripheral physiological processes is rather the consequence of their increase than of their reducing. Pekrun, Goetz, Daniels, Stupnisky&Perry [6,c.532] call attention, also, to the relationship between a boredom and the interest and positive emotions: “boredom is more than just a neutral state as defined by a lack of interest or enjoyment. There are many subjective states that are not enjoyable, but would not qualify as boredom».
Larson&Richards research fifth to ninth graders’ experiences of boredom in the early 90s. They cite the conclusions from researchers, conducted through the 1980s and 1990s, which find out, how it influences on the schoolwork. The boredom “diminishes attention, interferes with students’ performance, and is a frequent reason for dropping out of high school” [3, c.418]. Larson&Richards conceptualize two main models of the boredom, important for explanations of emotional experiences of adolescents — namely, psychological and social. In the first one, the boredom is caused by tasks, “that are repetitive and have become habituated for the individual” [3, c.420]. The authors identify two components of the psychological model: person’s dispositions and the situation which is established by the task. In the second one, the boredom is some kind of short-term social role. The person acts in keeping with the culturally perceived norms.
The models I have articulated above are not in contradiction. Five basic functional mechanisms underpin the control-value theory, applied to the scale of boredom, developed by Pekrun, Goetz&Perry [7, c.15]. They distinct the following types of resources for the class-related boredom:
cognitive resources, which are associated with distraction from important learning activities; for instance, the statements “Because I get bored my mind begins to wander “ or “I think about what else I might be doing rather than sitting in this boring class” are related to them;
motivation resources, which reduce the interest to taking some learning activities and limited efforts to do something during the class — for instance, the statement “I get bored”;
adherence to more rigid behavior strategies as these: “Because the time drags I frequently look at my watch” or “I get so bored I have problems staying alert”;
physiological change, which could be exemplified by the statement as “I start yawning in class because I’m so bored», and
affective feelings, which describe what exactly perceive the students during the class like the statements “During class, I feel like I could sink into my chair” or “The lesson bores me».
Building upon the varied dimensions of boredom, identified by Pekrun, Goetz&Perry [7] I carried out the investigation with Bulgarian students. The purpose was to estimate the reliability of a scale boredom. Furthermore, I conducted a one-way analysis of variance (ANOVA) to examine whether boredom scale’s scores were related to the grade of the students.
Against the above theoretical explanation, further, I addressed the following research tasks:
to measure developmental dimensions of negative, unpleasant feelings and deactivationdisplayed through class-related boredom and
secondly, to measure differences between students depending on their grade.
Participants were 343 students from four junior high schools in district Smolyan. The sample includes students from the fifth (114), sixth (162), seventh (49) and eighth(18) grade. The boredom scale, developed by Pekrun at all. [7] is composed of eleven items using a five-point Likert scale from “strongly disagree»,, “disagree», “neither agree, nor disagree», “agree” and “strongly agree». I conducted analyses in several stages using SPSS 10. for Windows. Each measure is described in details below.
I tested the reliability of the boredom scale by calculating Cronbach's alpha for all middle school students (N=340). The coefficient demonstrates the high reliability (internal consistency) of the scale. It achieves.8975. If items “Because the time drags I frequently look at my watch” and “During class I feel like I could sink into my chair” are deleted the reliability for this sample will be higher -.90. The mean for the scale is 22, 64; standard deviation — 10,4. In comparison with the results of Pekrun at all. [7] the scale mean is lower (22,64 vs. 30, 84). The same is truefor (.89 vs..93). The standard deviation, only, is almost equivalent (9,88 vs. 10, 4).
The correlations between the items were assessed using Cohen’s guidelines [4,c.132]. The calculated correlation for “During class, I feel like I could sink into my chair” is small — it does not exceed.29 for seven of the items in the scale. Generally, this refers to the items belonging to the groups which describe affective, physiological and strategy resources of the class-related boredom. The next two items — “Because the time drags I frequently look at my watch” and “I get restless because I can’t wait for the class to end” have a medium strength of the relationship — between.32 and.47. For the first one, it applies to the statements, such as: “I’m tempted to walk out of the lesson because it is so boring”; “I get restless because I can’t wait for the class to end”; “I get bored”; “I start yawning in class because I’m so bored”; “I think about what else I might be doing rather than sitting in this boring class». For the second one, the medium strength of the relationship is manifested in the assessments for the next items: “I get bored”; “I get so bored I have problems staying alert”;“The lesson bores me”; “Because I get bored my mind begins to wander”; “I find this class fairly dull». The largest correlation is the highest, between “I get bored” and “I find this class fairly dull” -.68. The statement “I’m tempted to walk out of the lesson because it is so boring” is in strength relationships with eight of the items in the scale — for example, the coefficient, with “I get restless because I can’t wait for the class to end” is.63. This trend is typical for other statements relating to the affective, physiological and cognitive characteristics of boredom. The claims “Because I get bored my mind begins to wander”; “I find this class fairly dull” and “I think about what else I might be doing rather than sitting in this boring class” show the strongest correlations with the problems such as staying alert, with starting yawn and with boring in the lesson. It is about values of the correlation coefficients as.58,.61,.60. This evidence provided information about the appropriateness of these items in the investigated sample of junior high students.
The relative frequencies for each item in the scale have shown that negative assessments predominate. For example, 61, 7 % of students said that they were “strongly disagree” or “disagree” with the statement “I get bored». The Pie-chart № 1 exemplifies this assessment. This response corresponds to the attitude to regulate highly their behavior during the class. 72, 2 % are not ready to walk out of the lesson because it is so boring [Pie-chart № 2].
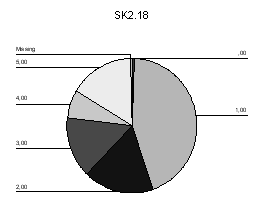
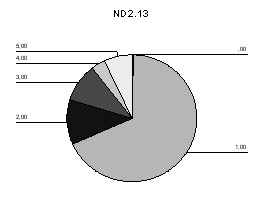
The Pie-chart № 1: I get bored The Pie-chart № 2: I am tempted to walk out of the lesson because it is so boring
Based on the initial results, I have conducted additionally a multivariate (generalized linear model) with a smaller sample of students: 46 from fifth grade, 51 from sixth grade, and 49 from seventh grade. All students attend one and the same school in the town of Smolyan. The calculated effect sizes (eta suqared — % of variance explained) for all items in the scale indicate the following information about the strength of association between each of them and the independent variable “grade». The effect size is small for the next items:
Because the time drags I frequently look at my watch (2, 1 %);
During class I feel like I could sink into my chair (1, 3 %).
The effect size is medium for other four items:
I get restless because I can’t wait for the class to end (3, 8 %);
I get so bored I have problems staying alert (4, 2 %);
I start yawning in class because I’m so bored (5, 2 %);
The lesson bores me (5, 4 %).
Below I will list the items with the large effect size:
I think about what else I might be doing rather than sitting in this boring class (6, 1 %);
I’m tempted to walk out of the lecture because it is so boring (6, 4 %);
I get bored (8 %);
Because I get bored my mind begins to wander (10, 3 %);
I find this class fairly dull (10, 5 %).
For the post-hoc analysis was applied Tuckey’s procedure. The table for multiple comparisons makes known the differences between the grades. It was detached a statistically significant difference of means between fifth and sixth grade of two variables, only:
I’m tempted to walk out of the lesson because it is so boring (-.6194);
I get bored (-.8819).
The differences between 5th and 7th grade refer to themost of items in the scale:
I’m tempted to walk out of the lecture because it is so boring (-.7622);
I get restless because I can’t wait for the class to end (-.6450);
I get bored (-.1, 0315);
I get so bored I have problems staying alert (-.5840);
I start yawning in class because I’m so bored (-.8092);
The lesson bores me (-.6765);
During class I feel like I could sink into my chair (-.2281);
Because I get bored my mind begins to wander (-.9494);
I find this class fairly dull (-1, 0036);
I think about what else I might be doing rather than sitting in this boring class (-.7794).
The results of Turkey’s HSD post-hoc test (on alpha level. 05) which were presented above, show a significant effect of age. However, means of judgments on the 10th items vary between 1,3 and 2,4. Although there are statistically significant differences, assessments of students across all three age groups tend to denial of boredom during the class.The importance of all components of the boredom, including, affective, cognitive, physiological, motivational and regulative is increasing with age. The results of this study provide important implications for educational research and practice. Beginning junior high-school students demonstrated greater sensitivity to the components of the boredom experience. Researching the situations which are boredom for the students, we could change the school practice and the “forced-effort model” [3, c.422] of education. Taken together, these results support the conclusion that 12–15 aged students, appear to assess the learning environment positively.
Acknowledgements: The research was financially supported by the University of Plovdiv, Bulgaria
References:
- Изследване на четивната и математическата грамотност на учениците в VІ клас.Анализ на резултатите.(2012). София: ЦКОКУО.
- Перспективи пред преподаването и ученето. Резултати от Международното изследване TALIS 2013на Организацията за икономическо сътрудничество и развитие (2015). София: ЦКОКУО.
- Larson, R.W., Maryse, H.R.(1991). Boredom in the middle school years.Blaming schools versus blaming students. American journal of education, Vol.99, No.4, pp.418–443.
- Palant, J.(2007). SPSS Survival Manual. Sydney: Open University Press.
- Pekrun, R., Frenzel, A., Goetz, Th., Perry, R.(2007). The Control-Value theory of achievement emotions: an integrative approach to emotions in education. In: Educational Psychology:Emotion in education (Ed. by Schutz, P., Pekrun, R.), Amsterdam, Boston, Heidelberg u. a.:Elsevier Academic Press, pp.13- 36.
- Pekrun, R., Goetz, Th., Daniels, L., Stupnisky, R., Perry, R.(2010). Boredom in achievement settings:exploring control-value antecedents and performance outcomes of a neglected emotion. Journal of Educational Psychology, Vol.102, No.3, pp.531–549.
- Pekrun, R., Goetz, Th., Perry, R.(2005).Achievement Emotions Questionnaire (AEQ). Manual.
Похожие статьи
Dimensions of Class-related Anxiety among the Students in the...
Основные термины (генерируются автоматически): SPSS, TALIS, AEQ, ANOVA, DURING, HSD, OECD, софия.
Data were expressed as mean ± standard error using one-way ANOVA by SPSS® version 17.0.
Class-related Characteristics of Enjoyment, Anxiety and Boredom in...
High factor loadings indicate that boring during the lesson does much harm to pupil’s activity. Even, if pupils enjoy learning their engagement during the lesson might be not so strong.
Основные термины (генерируются автоматически): AEQ, ANOVA, JCLP, SPSS.
Developmental aspects of enjoyment in the context of the middle school
Self-reports of scale “enjoyment” in the AEQ exhibit more than sufficient technical adequacy when used with 12–15-years old students.
Основные термины (генерируются автоматически): AEQ, SPSS, MANOVA, DURING, ANOVA.
Optimization of a protective medium for freeze-dried strains of...
An important role in maintaining of the viability of microorganisms during freeze-drying plays the protective medium. As a rule, the protective medium contains lipoprotector agents that preserve
Data were expressed as mean ± standard error using one-way ANOVA by SPSS® version 17.0.
A Consideration of the Relationship between Self-esteem and General...
Self esteem during university studies predicts career characteristics 10 years- journal of voccution al behavior.vd.
Furthermore, I conducted a one-way analysis of variance (ANOVA) to examine whether anxiety scale’s scores were related to the grade of the students.
Impact of conflict on poverty in Syria and economic policies for poverty...
‒ The informal economy has reportedly increased during the conflict. ‒ The data of this period is
The SPSS Statistical procedure requires all variables to be numeric.
According to the OECD, families receiving less than half of the average income in the country, in the US — 13.7 %, in Japan — 13.5 %.
Some problems of innovative-investment strategy of the development...
Analysis of asset allocation during the business cycle in Turkey. For example, based on the OECD Economic Forecast (November 2013), Turkey’s GDP growth for the years 2014–2015 is expected to be 4 %, while based on.
