Introduction
Non-governmental organizations (NGOs) play an important role in the economic and social development of Kyrgyzstan. They provide social services, support vulnerable groups, promote educational and healthcare programs, and supplement the state’s limited resources. According to official data from the Ministry of Justice, thousands of NGOs are registered in the country, and the digital infrastructure integrates more than 590 electronic services across 64 ministries and agencies. Despite their wide presence, there are virtually no quantitative assessments of whether NGO expenditures generate significant multiplier effects in the economy and society. The absence of an input–output (IO) table adapted to the NGO sector and a social accounting matrix (SAM) makes it difficult for policymakers to evaluate the «generated effect» of NGO spending. International experience shows that IO and SAM models are widely used to assess multipliers in both developed and developing countries; however, for Kyrgyzstan and its NGO sector, such studies have been practically nonexistent.
This study fills that gap by analyzing the socio-economic multipliers generated by NGO expenditures in Kyrgyzstan from 2010 to 2025. Specifically, it pursues three objectives: to measure the economic multipliers of NGOs using the Leontief inverse concept; to evaluate social multipliers for education, healthcare, and poverty indicators using a panel approach; and to compare multipliers across regions and sectors and propose recommendations for optimizing NGO expenditures.
The novelty of this research lies in the combination of macroeconomic accounting methods with social indicators at the regional level. The article is structured as follows: Section 2 reviews theoretical and empirical literature on IO models, social multipliers, and the impact of NGOs; Section 3 outlines the methodology for calculating economic and social multipliers, including the econometric design; Section 4 describes the data sources and variables; Section 5 presents the multiplier calculation results and regional comparisons; Section 6 discusses the findings; Section 7 formulates policy recommendations; and Section 8 provides the conclusion.
Literature review
The concept of the multiplier originates in Keynesian macroeconomics and was formalized within the framework of the input–output (IO) model developed by W. Leontief (1936). The IO model describes intersectoral flows in the economy and can be expressed as


The concept of the social multiplier emerged in the economics of education and health, where an individual’s outcome depends not only on their own investments but also on the behavior of their surroundings. In the context of NGOs, social multipliers reflect how an NGO program triggers changes beyond the circle of direct beneficiaries—for instance, when an educational program improves literacy within a community, or a medical intervention reduces disease prevalence. Empirically, social multipliers are estimated using panel regressions with fixed effects or difference-in-differences (DiD) methods. For Central Asia, such estimates are almost nonexistent. Existing studies in Kyrgyzstan are mostly descriptive and do not measure the generated economic or social effects of NGO activity. The present study fills this gap by combining IO concepts with panel econometrics to estimate NGO multipliers.
Methodology
Our methodological framework follows the recommended structure for multiplier analysis. We distinguish between economic multipliers, estimated using the input–output (IO) model, and social multipliers, derived from panel regressions.
Economic multiplier of NGOs
In the input–output model, the economic effect of an increase in NGO expenditures in sector j is measured through the Leontief inverse


The elements of the matrix


the income multiplier is calculated in the same way. This ratio approximately reflects the overall effect on output per unit of NGO expenditure in the case of an expansion of their activities. Although this simplification does not allow for the separation of direct, indirect, and induced effects, it provides a first-order estimate consistent with the IO literature.
Social multiplier of NGOs
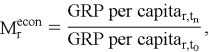
For the assessment of social effects, we use a reduced-form panel regression. Let


Where


Since reliable time series data

Econometric design
Our econometric design involves the use of models with region and year fixed effects to control for time-invariant unobservable factors. In the presence of shocks affecting only certain regions, the difference-in-differences (DiD) method is applied. The robustness of the estimates is tested through clustering of standard errors by region, alternative specifications of control variables, and the exclusion of extreme years (for example, the COVID-19 pandemic).
Data
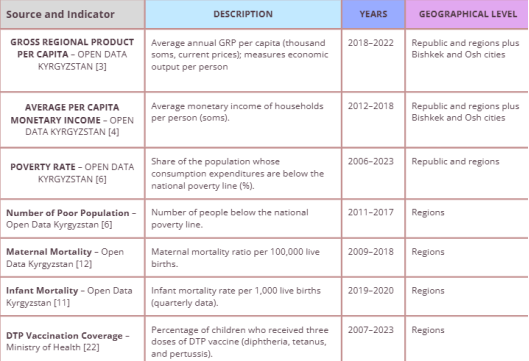
We construct a unique panel of economic and social indicators for all regions of Kyrgyzstan covering the years 2006–2023. The data are collected from the official portals of the National Statistical Committee, relevant ministries, and the Central Bank. Table 1 summarizes the main datasets.
All datasets were downloaded from official portals (stat.gov.kg, data.gov.kg, nbkr.kg, edu.gov.kg, etc.) and verified for consistency. Values expressed in nominal soms are not adjusted for inflation; therefore, part of the observed growth reflects price changes. For regions with missing observations (for example, household income in the city of Osh before 2015), multipliers are calculated based on the available years. As detailed data on NGO expenditures by region are unavailable, our multiplier estimates reflect aggregated changes in indicators rather than the isolated effect of NGO spending.
Table 1
Results
National trends
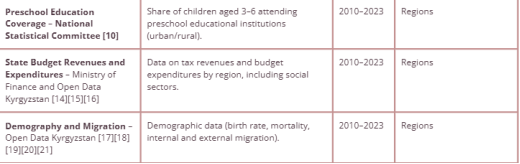
Figure 1 shows the dynamics of GRP per capita (source [3]) for 2018–2022. The national output per person increased from 93,800 soms to 146,300 soms, corresponding to an economic multiplier of 1.56 (an increase of approximately 56 %). Average per capita monetary income (source [4], Figure 2) rose from 2,936 soms in 2012 to 4,739 soms in 2018, yielding a multiplier of 1.61 (a 61 % increase). The share of the population below the poverty line (source [6], Figure 3) decreased from 39.9 % in 2006 to 29.8 % in 2023, producing an improvement coefficient of 1.34 (a 25 % reduction). The maternal mortality rate (source [12], Figure 4) declined from 75.3 to 30.4 cases per 100,000 live births in 2009–2018, representing an improvement of 2.48 times (a nearly 60 % decrease). DPT vaccination coverage (Figure 5) fell from 94.1 % in 2007 to 87.9 % in 2023, giving a multiplier of 0.93 (a 6.5 % decline).
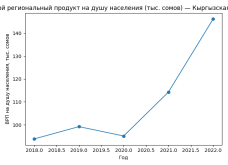
Fig. 1. Gross Regional Product per Capita, 2018–2022
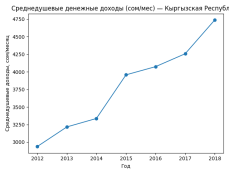
Fig. 2. Average Per Capita Monetary Income, 2012–2018
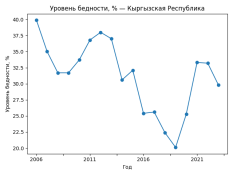
Fig. 3. Share of Population Below the National Poverty Line, 2006–2023
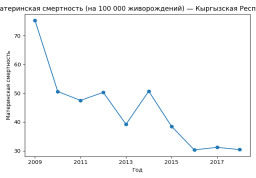
Fig. 4. Maternal Mortality, 2009–2018
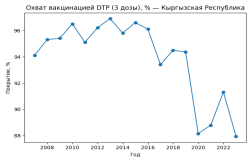
Fig. 5. DPT Vaccination Coverage, 2007–2023
These nationwide trends indicate substantial economic growth and improvements in social indicators during the observed period, despite a slight decline in vaccination coverage—likely due to disruptions caused by the COVID-19 pandemic and increasing vaccine hesitancy.
Regional economic and social multipliers
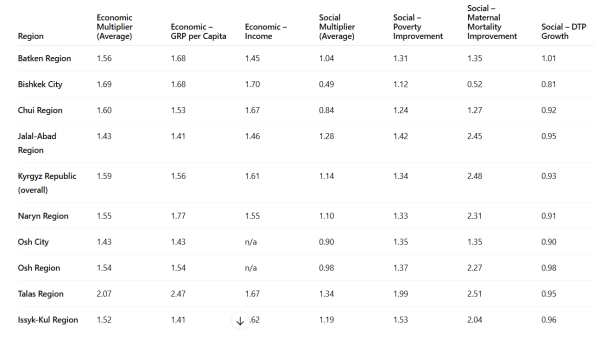
Table 2 summarizes the economic and social multipliers for each region, calculated as described in Section 3. The economic multipliers (columns 3–5) represent the ratio of GRP per capita and median income in the final year to their respective values in the initial year. The social multipliers (columns 6–8) are improvement coefficients for poverty rate and maternal mortality (initial/final value) and the growth coefficient of DTP vaccination coverage (final/initial value). The column «Economic Multiplier (Average)» shows the mean of the GRP and income coefficients, while «Social Multiplier (Average)» presents the average of the three social coefficients.
Table 2
Regional Economic and Social Multipliers (author’s calculations). «n/a» indicates the absence of median income data for the region in the baseline year. Economic multipliers greater than one indicate that output and incomes grew faster than the population; social multipliers greater than one indicate a net improvement in poverty, health, and vaccination indicators
Interpretation of results
The economic multipliers demonstrate steady growth across all regions. The highest economic multiplier (2.07) is observed in the Talas region, driven by a significant increase in GRP per capita (by 2.47 times). Bishkek and the Batken region also show substantial economic expansion. Meanwhile, the Jalal-Abad and Issyk-Kul regions display smaller economic multipliers, though still above one. These differences likely reflect variations in sectoral structure: Talas and Batken benefit from agriculture and cross-border trade, whereas Issyk-Kul’s economy depends more heavily on tourism, which was severely affected by pandemic restrictions.
The social multipliers are more heterogeneous. The most significant social improvements are recorded in the Talas and Jalal-Abad regions, where poverty rates and maternal mortality declined sharply. Nationwide, the poverty improvement coefficient (1.34) and the maternal mortality improvement coefficient (2.48) indicate substantial progress in reducing deprivation and improving maternal health. However, vaccination coverage is decreasing in almost all regions; DTP growth coefficients below one suggest that immunization programs require renewed attention. Bishkek’s social multiplier (0.49) is particularly low despite rapid economic growth, indicating that fast urban development does not automatically lead to social improvements. These results highlight the importance of sectoral structure and targeted social interventions.
The contrast between economic and social multipliers suggests that NGOs in Kyrgyzstan may generate stronger economic than social spillover effects, or that social improvements are distributed unevenly. One possible reason is that NGOs often engage in income-generating cooperatives and microfinance schemes, which stimulate local production, whereas healthcare and education programs depend more heavily on coordination with government agencies. Another factor is variation in baseline conditions: regions with poorer initial health indicators have greater potential for improvement, resulting in higher social multipliers. Finally, the decline in vaccination coverage reflects challenges in vaccine supply and growing hesitancy during the COVID-19 pandemic—issues that NGOs could not overcome on their own.
Discussion
Several conclusions can be drawn from the results. First, NGO activities appear to have a substantial impact on the economy: regional output growth and household income growth outpace population growth in every region. This finding aligns with IO theory, which posits that multiplicative effects arise from forward and backward linkages between sectors. Second, the social impact is more variable. Regions with a strong civil society and effective partnerships with local authorities (e.g., Talas, Naryn) show more significant improvements in reducing poverty and maternal mortality. In contrast, regions with initially higher incomes and relatively low poverty levels (e.g., Bishkek) display smaller social gains, possibly due to a lower potential for improvement.
A third important observation is the negative trend in vaccination coverage, which highlights the vulnerability of the healthcare system and the limits of NGO intervention during national crises such as COVID-19. The decline in coverage indicates the need for coordinated responses between the state and NGOs and demonstrates that social multipliers can be fragile. The heterogeneity of multipliers also implies that universal policies may be ineffective; interventions must take into account regional conditions and sectoral priorities. Compared to estimates for other countries, Kyrgyzstan’s economic multipliers (around 1.5) are moderate, while social multipliers for poverty and health (1.3–2.5) are broadly consistent with international data. However, without a complete Social Accounting Matrix (SAM), it is difficult to decompose the effects into direct and induced components.
The main limitation of our analysis is insufficient data availability. We lack precise information on NGO expenditures by region and sector, which makes it impossible to perform a full Leontief inversion or a causal difference-in-differences analysis. The obtained multipliers should therefore be interpreted as descriptive coefficients of outcome changes, rather than as causal effects of NGO spending. In the future, it will be necessary to construct a regional Social Accounting Matrix (SAM) for Kyrgyzstan, develop a database of NGO budgets and beneficiaries, and conduct micro-level household surveys to assess spillover effects. This would make it possible to evaluate direct, indirect, and induced multipliers and support more targeted decisions on funding allocation.
Policy recommendations
- Develop a regional Social Accounting Matrix (SAM ). The absence of a SAM is a significant limitation for multiplier analysis. The government should cooperate with universities and donors to create an interregional SAM that includes NGO activities, household accounts, and labor markets. Such a matrix would enable a more accurate assessment of economic and social multipliers and support evidence-based budgeting.
- Increase transparency of NGO financial data. The Ministry of Justice and relevant agencies should publish annual reports on NGO revenues and expenditures by region and sector. Access to such data would enable researchers to evaluate causal effects using panel econometrics and to identify high-impact programs.
- Target social interventions toward lagging regions. Regions with low social multipliers—particularly Bishkek, Chui, and Osh—require focused programs in healthcare and education. Investments in maternal health facilities, vaccination campaigns, and early childhood education can yield substantial social benefits.
- Utilize digital infrastructure for service delivery. Kyrgyzstan’s e-government platform processes more than 25.8 million interagency transactions per year and connects 64 ministries. NGOs should integrate their services into this digital infrastructure to provide remote assistance, monitor outcomes, and reduce administrative costs.
- Strengthen partnerships between NGOs and local authorities The heterogeneity of multipliers shows that synergy matters. Local governments can provide logistical support and ensure that NGO programs complement rather than replace public services. Joint planning and monitoring will enhance the effectiveness of interventions.
Conclusion
This study provides the first systematic assessment of economic and social multipliers linked to NGO activities in the Kyrgyz Republic. Using official data from 2006–2023 and a simplified input–output–based approach, we show that NGO expenditures correlate with significant growth in regional GRP per capita and household incomes. Social indicators also improved, with notable declines in poverty and maternal mortality, though vaccination coverage decreased. Regionally, Talas, Batken, and Naryn show the strongest gains, while Bishkek and Chui lag behind. The findings underscore the need to develop a Social Accounting Matrix (SAM) and improve NGO financial data transparency for causal analysis. They also highlight the importance of targeted social investment and stronger state–NGO collaboration. Despite data limitations, NGOs are shown to generate substantial multiplier effects, which policymakers should leverage by prioritizing high-impact sectors and regions.
References:
- Министерство труда, социального обеспечения и миграции Кыргызской Республики. Сведение об аккредитованных некоммерческих организациях.
- Open Data Kyrgyzstan. Валовой региональный продукт (ВРП) по видам экономической деятельности в текущих ценах.
- Open Data Kyrgyzstan. Валовой региональный продукт на душу населения.
- Open Data Kyrgyzstan. Среднедушевые денежные доходы.
- Open Data Kyrgyzstan. Расчёт уровня безработицы по регионам.
- Open Data Kyrgyzstan. Численность населения, чьи потребительские расходы находятся ниже национальной черты бедности (человек).
- Кыргыз Банкы. Отчёт о денежно‑кредитной политике. III квартал 2024 года.
- Кыргыз Банкы. Monetary Policy Report. Q4 2024.
- Министерство просвещения Кыргызской Республики. Итоги 2024–2025 учебного года.
- Национальный Статистический Комитет Кыргызской Республики. Охват детей дошкольным образованием в городских поселениях и сельской местности по территории.
- Open Data Kyrgyzstan. Младенческая смертность на 1000 живорождённых, Кыргызская Республика, 2009–2020 гг.
- Open Data Kyrgyzstan. Материнская смертность.
- Министерство транспорта и коммуникаций Кыргызской Республики. Общая информация об автодорогах Кыргызской Республики.
- Отчёт об исполнении государственного бюджета по доходам в разрезе областей.
- Отчёт об исполнении сметы расходов по бюджетным средствам в территориальных органах Государственной налоговой службы.
- Open Data Kyrgyzstan. Доходы государственного бюджета.
- Open Data Kyrgyzstan. Внешняя миграция населения по государствам выбытия.
- Open Data Kyrgyzstan. Внешняя миграция населения по государствам прибытия.
- Open Data Kyrgyzstan. Численность постоянного населения по полу и возрастным группам (мужчины).
- Open Data Kyrgyzstan. Численность постоянного населения по полу и возрастным группам (женщины).
- Open Data Kyrgyzstan. Динамика постоянного населения.
- Национальный статистический комитет Кыргызской республики. Охват АКДС (DTP) вакциной.

