


This paper is intended to fill a gap in economic literature concerning the influence of R&D on developing countries. The empirical analysis is based upon the data representing various indicators of the Russian economy in the period between 1999 and 2014. Firstly, we did a thorough review of the existing literature regarding this topic. Then we examined the datasets and conducted a correlation analysis. Finally, we created a linear regression model and obtained the results demonstrating that expenditures on R&D did not make a significant contribution to the GDP growth in Russia, whereas household spending and net exports were the most influential factors.
Keywords: R&D, GDP, developing countries, Russia, regression analysis
Introduction
We firmly believe that one of the most crucial and decisive factors of long-term economic growth is investment in Research and Development (R&D), the substance of which tends to be underestimated not only by manufacturers but by some economists as well. R&D can provide a platform for creativity and innovation to flourish in an organisation or a country. That is the reason why in this study, we aim to observe certain aspects that may have an impact on GDP and investigate how gross expenditure on R&D (GERD), as an aggregate indicator of innovative activity, affects the GDP of Russia on a large scale.
In this paper, we address the dilemma of increasing R&D expenditures and facing a possible negative effect on economic performance in the short run or decreasing R&D spending and ending up with dismal consequences in the long run.
The existing economic literature briefly covers the impact of R&D on business performance in general, typically within competitive environments. After a thorough literature review, it became obvious that many scholars had been trying to find the link between R&D and growth and that there were two contradictory points of view.
One of them, developed by Chan, Lakonishok and Sougiannis in “The Stock Market Valuation of Research and Development Expenditures” (2001) suggests [1] that there is no conspicuous connection between investments in R&D and increase in sales. Although this is not a mainstream opinion, it is still worth taking into consideration.
The other point of view, which appears to be predominant today, is that there is a positive influence of R&D expenditures on productivity and on GDP in general. For instance, Özcan Karahan (2015) examines the relationship between the intensity of business enterprise R&D expenditure and high technology specification in European countries by a panel causality analysis. His research [2] is based on the data on the European countries from 2000 to 2013. He came to the conclusion that R&D intensity could be seen as the key driver of high-tech development in Europe, making a huge contribution to the overall growth of productivity.
Akcali and Sismanoglu (2015) collected data on 19 countries (both developed and developing ones) and conducted a panel data analysis [3], which suggests that the impact of R&D may vary considerably depending on the current level of development of a country.
Argentino Pessoa in the work “Innovation and Economic Growth: What is the actual importance of R&D?” [4] (2007) focused on developed OECD countries and examined the relationship between R&D intensity and economic growth, but failed to find a strong link. That led the author to the conclusion that there could be other investments spurring economic growth, which could have more impact on economic performance than R&D.
Silaghi, Alexa, Jude and Litan (2013) in their research [5] found out that R&D activity had a statistically significant impact on economic growth. They compared the roles of private and public R&D and revealed that public R&D did not crowd out the positive effect of private R&D in the estimations. Their results show that the public R&D has a neutral effect, in the sense that it does not stimulate growth, but it does not crowd out the positive effect of private R&D either. However, they struggled to make a recommendation to policy-makers to stop increasing public R&D, since the authors were unsure of its irrelevance.
The research [6] of Oliviero Carboni (2016), contrariwise, suggests that government subsidies in R&D, apart from having a direct beneficial effect, may generate a significant additional effect on firms. According to the author, government support can also ease financial constraints and have a positive effect on the borrowing capacity of firms. Moreover, the author believes that the effect of public subsidies might last longer than the incentive itself.
Unfortunately, the datasets, which most of those studies are based upon, represent developed countries, active in R&D (e.g. OECD) (“R&D and productivity in OECD firms and industries: A hierarchical meta-regression analysis”, Mehmet Ugura, Eshref Trushin, Edna Solomon, Francesco Guidi, 2016). [7]
That is why the results of those papers are not always applicable to some countries or under some circumstances, and for good reason, because by mostly examining advanced developed economies, they are unable to explain the impact of R&D on the developing countries and what effects it might lead to. There are very few, if any, articles and studies, exploring the ways R&D activity affects GDP of developing economies in this context.
One such study is the ground-breaking work [8] of Tuna, Kayakan and Bektas (2016), in which they examined the case of Turkey, using the data covering the period of 1990 to 2013, and found no long-term relationship between real R&D expenditures and economic growth. The authors attributed the result of their empirical study to the fact that Turkey was a developing country and it required much more time to implement innovations and receive a yield in return.
Russia is also a developing country and, judging from the latter research, we ought to formulate the hypothesis that it is unlikely that there is a strong positive correlation between R&D and the GDP growth in Russia.
Data collection and Methodology
The datasets [9–13] used in this study were acquired from the World Bank (foreign direct investment, total population and government spending), the OECD (GDP per capita, household spending, gross domestic spending on R&D and trade in goods) and the Russian Statistical database (investments in fixed capital per capita). Some data required converting into US dollars. Net exports data were collected by subtracting imports from exports (OECD data).
In order to analyse the relationship between R&D expenditures and the GDP of Russia, we divided all the data per capita to obtain more accurate results, conducted a correlation analysis and performed a regression analysis, for which we took gross domestic spending on R&D (GERD) as the main indicator of innovative activity and some other economic indicators including household spending, investment in fixed capital, foreign direct investment, exports, imports and government spending, which, to a certain extent, characterise the level of technological and economic development of a country.
GERD data and their components are compiled based on the OECD Frascati Manual 2002 methodology [14], which defines R&D as — «creative work undertaken on a systematic basis to increase the stock of knowledge, including knowledge of man, culture and society, and the use of this stock of knowledge to devise new applications”. GERD is usually broken down among four sectors of performance: business enterprise, higher education, government and private not-for-profit institutions serving households. GERD is often reported in relative terms as a percentage of GDP, to denote the R&D intensity of an economy.
Fixed investment (FCI) refers to investment in fixed capital or to the replacement of depreciated fixed capital. Thus, Fixed Investment is an investment in physical assets such as machinery, land, buildings, installations, vehicles, or technology.
Foreign direct investment (FDI) includes mergers and acquisitions, building new facilities, reinvesting profits earned from overseas operations and intra-company loans. FDI is the sum of equity capital, other long-term capital, and short-term capital. FDI usually involves participation in management, joint-venture, transfer of new technology and expertise. Therefore, it is a crucial factor of innovative activity in the process of catching-up development.
To quantify the strength of the relationship between gross domestic spending on R&D, other variables and GDP, we conducted a correlation analysis and calculated the correlation coefficients (r) between them. We take into consideration that correlation is not causation and can only be used to estimate the extent of the relationship, which may vary from -1 to +1, being negative or positive respectively. That is, we cannot state that one variable influences another, because of the third variable problem. A correlation analysis is not sufficient to describe those associations between variables for this particular study. After finding a significant correlation, we created a linear regression model to examine the relationship in a proper way. Since we wanted to eliminate the devastating influence of the collapse of the USSR on the Russian economy, we focused on the period between 1999 and 2014.
Data examination
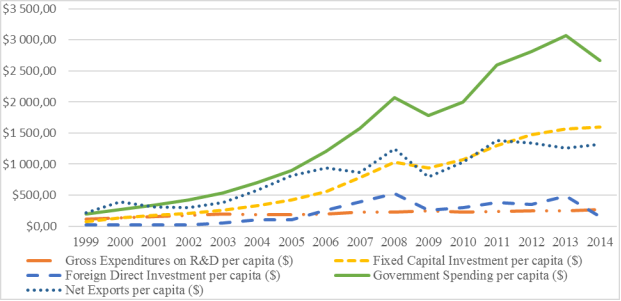
Figure 1. Main economic indicators. Sources: World Development Indicators, World Bank national accounts data, OECD national accounts data files, Russian Statistical Agency
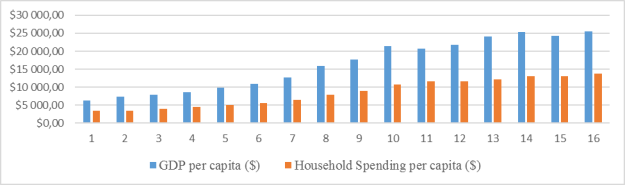
Figure 2. The GDP and household spending (both per capita). Source: OECD (2017)
Per Figure 1, there is a conspicuous upward trend in all indicators we took for the analysis (except for foreign direct investment and government spending, which fell dramatically). Although the global economic recession of 2008 had a detrimental effect on the Russian economy, the indicators managed to recover and now demonstrate a robust growth. For instance, GERD has more than doubled since 1999, when it was around $112.48 per capita. In 2014, it achieved $265.72. Figure 2 shows that the share of consumption in GDP has constantly been growing since 1999. In 2014, it accounted for over a half of the GDP.
Correlation analysis
Table 1
Correlation Matrix
|
|
GDP |
Household Spending |
Gross Expenditures on R&D |
Fixed Capital Investment |
Foreign Direct Investment |
Government Spending |
Net Exports |
|
GDP |
1 |
||||||
|
Household Spending |
0.995922343 |
1 |
|||||
|
GERD |
0.940224882 |
0.94596 |
1 |
||||
|
Fixed Capital Investment |
0.980779452 |
0.98167 |
0.914271195 |
1 |
|||
|
FDI |
0.823534472 |
0.795042 |
0.739740424 |
0.773146744 |
1 |
||
|
Government Spending |
0.983346851 |
0.9793252 |
0.910200429 |
0.994054279 |
0.82560828 |
1 |
|
|
Net Exports |
0.959933312 |
0.93753 |
0.863476922 |
0.938869847 |
0.835752063 |
0.952893 |
1 |
r (GDP and Household Spending) = 0.995922343 (very strong positive correlation)
r (GDP and GERD) = 0.940224882 (very strong positive correlation)
r (GDP and Investment in Fixed Capital) = 0.980779452 (very strong positive correlation)
r (GDP and Foreign Direct Investment) = 0.823534472 (very strong positive correlation)
r (GDP and Government Spending) = 0.983346851 (very strong positive correlation)
r (GDP and Net Exports) = 0.959933312 (very strong positive correlation)
Our test results suggest that there is an extremely strong relationship between all examined variables and the GDP of Russia. All the coefficients are close to 1, which means that the variables are undoubtedly linked with GDP and even a small change in one of them inevitably affects it.
Regression Analysis
Furthermore, we scrutinise the relationship between the variables and the GDP, running a regression analysis and creating a linear regression model, which can predict and explain the processes related to this matter.
As the X Range, or the range of explanatory (independent) variables we select household spending, GERD, investment in fixed capital, foreign direct investment and net exports (all the variables are per capita), whereas the Y range, or the range of predictor variables (also called dependent variables), is represented by the GDP of Russia (per capita).
Table 2
Regression Statistics (Model 1)
|
Multiple R |
0.999076241 |
|||||
|
R square |
0.998153335 |
|||||
|
Adjusted R square |
0.996922225 |
|||||
|
Standard error |
396.4057189 |
|||||
|
Observations |
16 |
|||||
|
|
df |
SS |
MS |
F |
Significance F |
|
|
Regression |
6 |
764418952.3 |
127403158.7 |
810.775045 |
0.000 |
|
|
Residual |
9 |
1414237.446 |
157137.4939 |
|||
|
Total |
15 |
765833189.8 |
||||
R Square equals 0.998, which is an ideal fit. The closer to 1, the better the regression line fits the data. To check whether the results are reliable (statistically significant), we examine the Significance F (0.000). This value is much less than 0.05, therefore we can state that this set of variables is perfect for the model.
Table 3
Regression coefficients (Model 1)
|
|
Coefficients |
Std Error |
t-stat |
P-value |
Lower 95% |
Upper 95% |
|
Intercept |
399.8497297 |
902.999 |
0.44 |
0.66836 |
-1642.876 |
2442.575 |
|
Household Spending |
1.393006497 |
0.19286 |
7.22 |
0.00005 |
0.9567184 |
1.82929 |
|
Gross Expenditures on R&D |
4.785860211 |
7.306 |
0.655 |
0.5288165 |
-11.74152 |
21.313 |
|
Fixed Capital Investment |
1.158403209 |
3.06182 |
0.378 |
0.713949 |
-5.7679 |
8.08472 |
|
Foreign Direct Investment |
2.135785164 |
1.715456639 |
1.245 |
0.24456 |
-1.744847 |
6.0164 |
|
Government Spending |
-0.632867636 |
1.733126 |
-0.365 |
0.7234 |
-4.55347 |
3.2877 |
|
Net Exports |
3.367990159 |
0.8668976 |
3.885 |
0.0037 |
1.4069 |
5.329 |
Unfortunately, the p-values of some variables are higher than 0.05, which clearly demonstrates that they do not have a significant impact on the GDP. Judging from that, we calibrated this model ruling out gross expenditures on R&D, fixed capital investment, foreign direct investment and government spending.
Table 4
Regression Statistics (Model 2)
|
Multiple R |
0.99877113721694 |
|||||
|
R square |
0.99754378453762 |
|||||
|
Adjusted R square |
0.99716590523571 |
|||||
|
Standard error |
380.389610221173 |
|||||
|
Observations |
16 |
|||||
|
|
df |
SS |
MS |
F |
Significance F |
|
|
Regression |
2 |
763952138.4536 |
381976069.2268 |
2639.84764 |
0.00000 |
|
|
Residual |
13 |
1881051.32233 |
144696.25556 |
|||
|
Total |
15 |
765833189.77593 |
||||
Table 5
Regression Coefficients (Model 2)
|
|
Coefficients |
Std error |
t-stat |
P-value |
Lower 95% |
Upper 95% |
|
Intercept |
694.26240469998 |
237.902152229664 |
2.9182687007798 |
0.01198026911765 |
180.306051717974 |
1208.21875768199 |
|
Household Spending |
1.48659626934407 |
0.0740871153189 |
20.065516965333 |
0.00000000003645 |
1.32654078756136 |
1.64665175112677 |
|
Net Exports |
3.73554246370176 |
0.68115604899957 |
5.48412139800894 |
0.00010494159228 |
2.26399428528306 |
5.20709064212046 |
All the p-values are much lower than 0.05, therefore we can deem this model reliable, relatively accurate and statistically significant.
Finally, we obtain the regression line, representing the link between GDP and household spending (C, consumption) + net exports (NX):
Y = 694.26240469998 + 1.48659626934407 * C + 3.73554246370176 * NX
Conclusion
By means of conducting a correlation analysis and creating a linear regression model based on the data for the period between 1999 and 2014, we revealed that Russia turned out to be similar to Turkey [8], in a sense that for the latter there was no link between R&D and growth, and, likewise, in Russia, we observed that GERD did not make a significant contribution to the GDP. We had to eliminate expenditure on R&D, since this factor was not influential. In our improved version of the model, household spending has a coefficient of about 1.49, whereas net exports have that of almost 3.74, which means that the economy of Russia is heavily dependent on the exports of raw materials, we know that they are primarily oil and gas. Our hypothesis proved correct; In Russia, as well as in Turkey, there is no serious effect of R&D on the GDP. In our model, it was irrelevant, which suggests, that R&D does not have an obvious impact on the developing countries, due to the structure of their economies.
Yet, we acknowledge that our regression model is rather simplistic and it might not reflect all causes of the GDP growth accurately. With that in mind, we are determined to improve and calibrate this model in our further papers.
References:
- Chan, L. K. C., Lakonishok, J. and Sougiannis, T. (2001), “The Stock Market Valuation of Research and Development Expenditures”. The Journal of Finance, 56: 2431–2456. doi:10.1111/0022–1082.00411
- Özcan Karahan (2015), “Intensity of Business Enterprise R&D Expenditure and High-Tech Specification in European Manufacturing Sector”. Procedia — Social and Behavioral Sciences, Volume 195, Pages 806–813. http://dx.doi.org/10.1016/j.sbspro.2015.06.180
- Akcali B. Y., Sismanoglu E. (2015), “Innovation and the Effect of Research and Development Expenditure on Growth in Some Developing and Developed Countries”. Procedia — Social and Behavioral Sciences, Volume 195, Pages 768–775. doi: 10.1016/j.sbspro.2015.06.474
- Argentino Pessoa (2007), “Innovation and Economic Growth: What is the Actual Importance of R&D?” Universidade do Porto.
- Monica Ioana Pop Silaghi, Diana Alexa, Cristina Jude, Cristian Litan (2014), “Do business and public sector research and development expenditures contribute to economic growth in Central and Eastern European Countries? A dynamic panel estimation”. Economic Modelling, Volume 36, Pages 108–119. http://dx.doi.org/10.1016/j.econmod.2013.08.035
- Oliviero A. Carboni (2016), “The effect of public support on investment and R&D: An empirical evaluation on European manufacturing firms”. Technological Forecasting and Social Change. http://dx.doi.org/10.1016/j.techfore.2016.11.017
- Mehmet Ugur, Eshref Trushin, Edna Solomon, Francesco Guidi (2016), “R&D and productivity in OECD firms and industries: A hierarchical meta-regression analysis”. Research Policy, Volume 45, Issue 10, Pages 2069–2086. http://dx.doi.org/10.1016/j.respol.2016.08.001
- Kadir Tuna, Emir Kayacan, Hakan Bektas (2015), “The Relationship between Research & Development Expenditures and Economic Growth: The Case of Turkey”. Procedia — Social and Behavioral Sciences, Volume 195, Pages 501–507. doi:10.1016/j.sbspro.2015.06.255
- OECD (2017), Gross domestic product (GDP) (indicator). doi:10.1787/dc2f7aec-en
- OECD (2017), Household spending (indicator). doi: 10.1787/b5f46047-en
- OECD (2017), Gross domestic spending on R&D (indicator). doi: 10.1787/d8b068b4-en
- OECD (2017), Trade in goods (indicator). doi: 10.1787/1ea6b5ed-en
- World Development Indicators, World Bank national accounts and OECD National Accounts data files. Last updated, 28 December 2016.
- OECD Science, Technology and Industry Scoreboard, OECDiLibrary, 2011.
