


1. Introduction
The problem of road safety is one of the priorities for a country with a rapidly growing use of cars. An effective solution of this problem contributes to a rapid development of the transport sector without increasing the negative component (number of accidents, the number of injuries and deaths). Russia is also a country with a rapidly growing use of cars. The growth rate of the motorization level is very high.
The motorization level in the Russian Federation stands at approximately 254 vehicles per 1000 inhabitants in 2012. In 2003 it was around 160 vehicles per 1000 inhabitants, and the number of motor vehicles has increased by some 411 % from 1990 (8964 thousand) to 2012 (36900 thousand). In spite of this, the motorization level in Russia is much lower than in others countries (Figure 1).
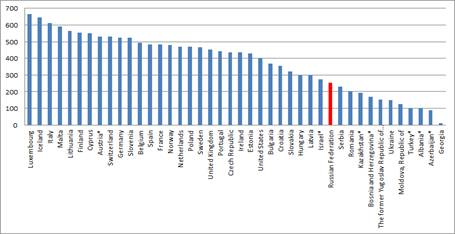
Figure 1. Number of passenger cars per 1000 inhabitants in 2011 (*2010)
Source: UNECE Transport Division Database
In the same time, the number of accidents and the number of victims in Russia are much higher than in countries with a high motorization level (Figure 2).
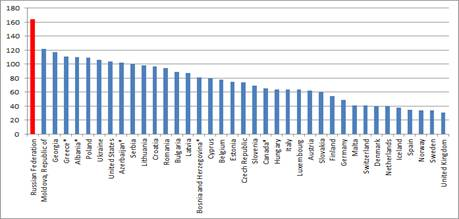
Figure 2. People killed in road traffic accidents, per million inhabitants in 2011 (*2010)
Source: UNECE Transport Division Database
The high number of road traffic injuries in Russia is highly dependent on human factors: driver’s behaviour, the lack of preparedness, recklessness on the roads, drunk driving and drunken pedestrians, improper road safety of drivers and pedestrians and, in some cases — on the state of health of both of them.
2. Statistics
Further there is some statistical information which will be important for the consideration the traffic safety problem in Russian Federation.
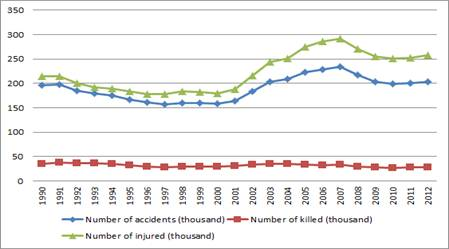
Figure 3. Time series of road crashes, deaths and injuries in the Russian Federation, 1990–2012
Source: For the data 1990 -2004: Statistical Yearbook of Russia2005 (1990–2004);
For the data 2005–2011: Statistical Yearbook of Russia 2012 (2005–2011);
For the data 2012: http://www.gibdd.ru/ (2012);
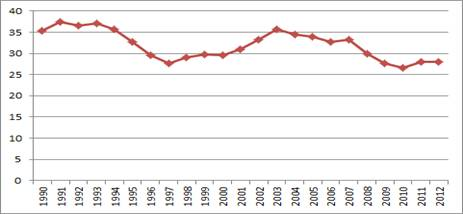
Figure 4. Number of killed (thousand)
Source:
For the data 1990–2004: Statistical Yearbook of Russia 2005 (1990–2004);
For the data 2005–2011: Statistical Yearbook of Russia 2012 (2005–2011);
For the data 2012: http://www.gibdd.ru/ (2012);
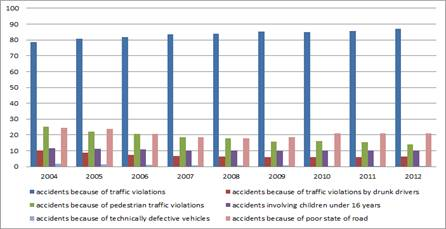
Figure 5. Causes of accidents in percentage, 2012
Source: http://www.gibdd.ru/
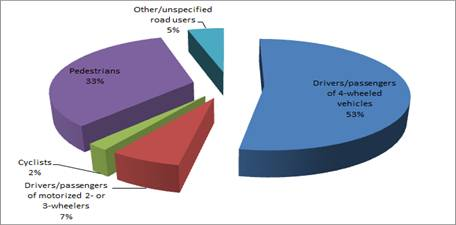
Figure 6. Road deaths by road user class, 2010
Source: World Health Organization (WHO)
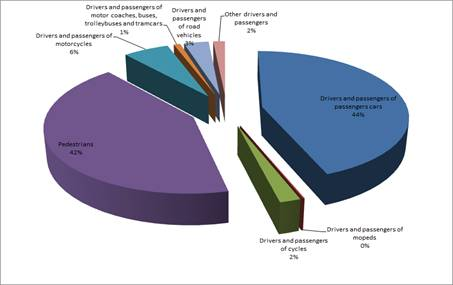
Figure 7. Road deaths by road user class, 2004
Source: UNECE Transport Division Database
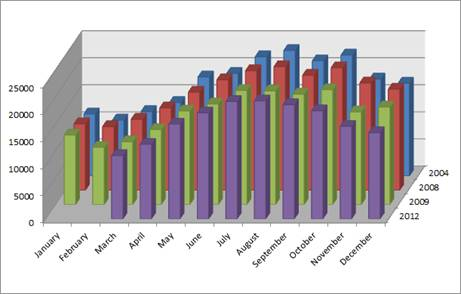
Figure 8. Number of road accidents by month and year
Source: For the data 2004–2009: UNECE Transport Division Database;
http://w3.unece.org/pxweb/
For the data 2012: http://www.gibdd.ru/
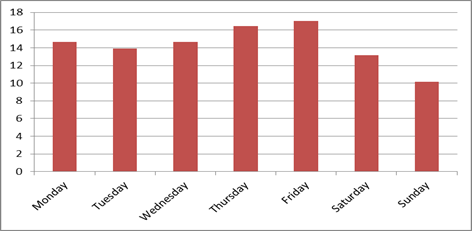
Figure 9. Road accidents by day of week, 2011
Source: http://gibdd-slv.ru/content/statistika-dtp
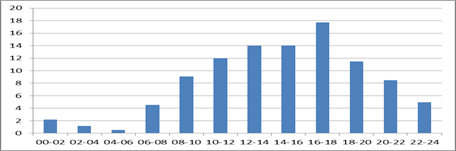
Figure 10. Road accidents by time of a day, 2011
Source: http://gibdd-slv.ru/content/statistika-dtp
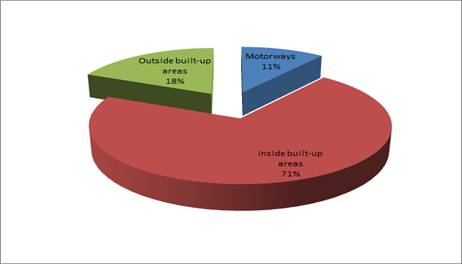
Figure 11. Road accidents by location, 2009
Source: UNECE Transport Division Database
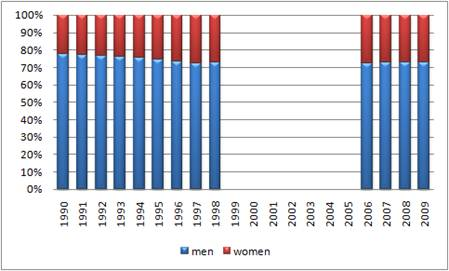
Figure 12. The percentage of dead men and women
Source:
For the data 1990–1998: World Health Organization regional office for Europe
http://www.euro.who.int/en/home
For the data 2006–2009: The Demographic Yearbook of Russia. 2010
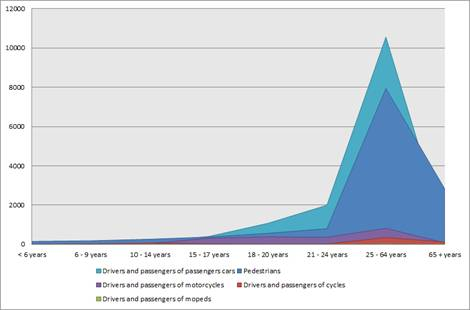
Road deaths by age, 2004
Source: UNECE Transport Division Database, http://w3.unece.org/pxweb/
3. Interpretation of statistical data
Major indicators of accidents
For the most general information the dynamics of major accidents rates since 1990 should be considered. According to the data from Statistical Yearbook of Russia (Figure 3), there have been continuous reductions in crashes, deaths and injuries between 1991 and 1997 coinciding with a period of economic decline.
Further increases in all outcomes since 1998, with steepest increases in crashes, injuries, deaths in the years 2001–2007, coinciding with a period of economic growth and improvements in the system of data collection for the road accident database. In seven years (2001–2007) the number of accidents and injuries has increased by 48 % and 63 % respectively. The peak of fatalities in road accidents is in 2003 (Figure 4). The number of accidents and injured has decreased by 15 %, the number of fatalities — by 20 % in 2010 compare to 2007. Thus, there is a positive change, but in 2012 the number of accidents increased again by about 1 %.
According to the data showing on Figure 5:
- The number of children under 16 killed or injuries in traffic accidents decreased by 33 % (from 1405 to 940 children) and by 10 % (24693 to 22016 children) respectively from 2004 to 2012;
- More than 80 % of all accidents occur due to the violation of traffic rules by drivers;
- A fifth of all accidents caused by the poor state of roads. According to the Global Competitiveness Report 2011–2012 Russia was on the 130th place concerning on the quality of roads in 2010 (in a list of 142 countries);
- In 2012 14 % of the accidents were caused by violation of traffic rules by pedestrians, this index was 25 % in 2004.
- The number of accidents caused by drunk drivers decreased from 10 % on 2004 to 6 % in 2012.
Changes are likely related to an increase in penalties and the introduction of a new provision of law and regulations and more attention to the problem of road safety by the authorities.
Deaths by type of road user
Pedestrian deaths and deaths of drivers and passengers contribute respectively to over 33 % and 53 % of total deaths (Figure 6). Though the share of the total number of pedestrians killed in 2010 is high, it fell by 10 percent compared to 2004 (Figure 7).
Accidents by time of year and location
The highest number of accidents occurs from July to October (Figure 8).
The most “dangerous” days of the week are Thursday and Friday (Figure 9).
Most road traffic crashes occur in the period from 12.00 hours to 18.00 hours (Figure 10) and those with most serious consequences occur at night between midnight and 07:00 hours[1] (Road Safety Performance. National Peer Review: Russian Federation, 2006).
According to the data for 2009 the highest number of accidents occurs within cities, they account for over 70 % of all accidents (Figure 11).
Deaths by sexand age
Men are killed in road accidents more often than women — 70 % of people killed in accidents are men (Figure 12). The percentage ratio has not changed a lot from 1998 to 2006. And even there is no data for the period 1999–2005[2] it can be assumed there were no significant changes in the ratio.
The majority of deaths occur to the drivers and passengers of cars and pedestrians between ages from 25 to 64 years (figure 13).
4. Measures
Following measures were adopted to improve road safety:
1. The federal target program «Improving road safety» started in 2006. The program aimed to reduce the number of persons killed in road accidents by 1.5 times in 2012 compared to 2004. According to the data, in 2004 the number of death was 34500 people, in 2012–28000. Consequently, the program doesn’t reach its goal, because number of deaths exceeds the target value by 5000.
2. In 2007, 2008 following penalties were increased:
|
Violation |
Old penalties |
New penalties |
|
The lack of a special chair for transporting children up to 12 years old |
– |
3 (12 Euro in 2009) |
|
Driving with unfastened seat belt |
3 Euro |
12 Euro |
|
Speeding at 40–60 km/h |
5–8 Euro |
25–38 Euro |
|
Speeding more than 60 km/h |
50–63 Euros or driving ban for 4–6 months |
These measures were positive:
1. Though the proportion of accidents involving children has not decreased, the number of deaths was 9 % less (from 1116 to 1018 children) and the number of injuries was 8 % less (from 24707 to22758 children) in 2008 than in 2007.
2. In 2008 the number of accidents, deaths and injuries decreased by 10 % compared to 2007.
3. Today there are an official statistics on causes and number of accidents since 2004. Before that such kind of data did not exist or were only partially available. The availability of statistics makes it easier to evaluate the situation on the roads, to identify the causes of accidents and to take action more effectively.
5. Interesting trends in the development of transport infrastructure
An interesting feature of traffic in Russia is the fact that over the last two years a large number of drivers have installed digital video recorders (DVRs) in their cars. They become very popular in 2011 and in 2012. About 1 million recorders were sold. Records made by DVRs can serve as proof of innocence in the case of an accident, or might help when faced with unlawful actions of traffic police. Also, a video recorder in the car helps a driver to maintain within the traffic rules. This is due to the fact that in the event of an accident the record can prove innocence as well as guilt of the drivers involved.
Moreover since 2011 in many patrol cars DVRs are also installed. This change was made in order to reduce corruption on the roads. It means that cameras must record everything what is going on inside and outside of the car. Thus the possibility of offering and extortion bribes was minimized. And in the case of an accident there is a record of the event. However, the large number of DVRs in individual cars, and many of the reviews and the videos on the Internet testify that the system is not working well enough.
But DVRs are useful not only for individual drivers. In the middle of March 2013 Moscow government proposes to install DVRs in buses to capture traffic violators traveling by lane allocated for public transport.
The popularity and usefulness of DVRs on Russian roads, however, does not mean an increase in their use abroad, such as Europe. For instance, Austria banned the installation of video recorders in private cars, considering the use of such devices invasion of privacy. The offender will pay 10 thousand Euro of fine if installation of the DVR was unauthorized, if it is a reinstallation — 25 thousand Euro. In addition, the residents captured by the DVR can file a civil lawsuit in the amount of 20 thousand Euro. At the same time the Austrian newspaper «Kleine Zeitung» reported that the authorities of the municipality Graz officially allowed the installation of surveillance cameras in public transport to do a record of the events on the road.
6. Conclusions
1. Most accidents occur due to non-compliance with traffic rules, and the main victims are the drivers, passengers of cars and pedestrians;
2. Most accidents occur from 12 pm to 6 pm, mostly in built-up areas;
3. More than 70 % of all persons are killed in accidents are men of working age (the age of the greatest number of victims is between 25 and 64 years old);
4. Although the number of accidents and victims are still very high, there is a tendency of decline;
5. Road safety problem has received more attention from the State: a federal program was implemented; the procedure for collecting data of the causes and consequences of an accident has changed and it provides a more detailed picture of what is happening on the roads;
6. The presence of DVRs in private cars obliges drivers to a strict observance of the rules of the road. This is undoubtedly a positive component in terms of increasing traffic safety.
References:
1. UNECE Transport Division Database, http://w3.unece.org/pxweb/
2. Statistical Yearbook of Russia 2005 (1990–2004);
3. Statistical Yearbook of Russia 2012 (2005–2011);
4. http://www.gibdd.ru/
5. http://gibdd-slv.ru/content/statistika-dtp
6. World Health Organization regional office for Europe, http://www.euro.who.int/en/home
7. The Demographic Yearbook of Russia. 2010
