Introduction
The problem of drinking water access in Kyrgyzstan remains relevant not only for remote villages, but also for small towns with ageing Soviet-era infrastructure. Rost, Ratfelder, and Topbaev argue that the analysis of water supply in Central Kyrgyzstan cannot be reduced to physical infrastructure alone; it must also address management, tariff acceptance, financial sustainability, and everyday household experience [1, pp. 863–870]. Their Kara-Suu study is methodologically important because it combines household evidence with institutional evidence and treats water service as both a technical and a governance problem [1, p. 864].
This article applies a similar logic to Orlovka, but without the mapping component used in the Kara-Suu paper. The purpose is to assess whether formal access in Orlovka corresponds to effective access, which service limitations remain visible at the household level, and whether the local water problem can be described as economic in a meaningful analytical sense. This framing is also consistent with earlier work on water governance in Kyrgyzstan, which emphasizes decentralization, weak institutional capacity, and the difficulty of sustaining local systems under financial constraints [2; 3; 4; 5].
Three research questions guide the article. First, what is the actual level of household access to drinking water in Orlovka? Second, what service limitations remain despite relatively broad network coverage? Third, do the survey and interview results justify treating the Orlovka case as a problem of economic sustainability in addition to infrastructure?
Materials and Methods
The article follows an adapted case-study design based on the methodological logic of Rost et al. In the Kara-Suu study, the empirical base combined a quantitative household survey, a standardized questionnaire, observations, and semi-structured expert interviews [1, p. 864]. The present article uses the same mixed-method principle, but omits mapping because the aim is to analyse access, reliability, and economic constraints rather than the spatial structure of the system.
The main empirical material is a household survey of 61 respondents in Orlovka. The questionnaire covered connection type, principal water source, service continuity, seasonal variation, perceived water quality, information on laboratory testing, payment practice, and willingness to accept a moderate tariff increase under improved service conditions. The survey results were processed descriptively through percentages for the core indicators.
To complement the household perspective, a semi-structured interview was conducted with the director of Orlovka Vodokanal. The interview addressed the enterprise’s legal status, service area, source of water, network condition, water losses, meter coverage, tariff formation, cost recovery, accidents, staffing constraints, and investment priorities. This design makes it possible to compare household experience with provider-side constraints and to test whether the article’s research questions are answered by both sides of the evidence [6; 7].
Table 1
Key household survey indicators in Orlovka (n = 61)
|
Indicator |
Value |
Interpretation |
|
Connected to centralized network |
88.5 % |
High formal coverage |
|
Indoor water as the main drinking water source |
83.6 % |
Predominantly in-house access |
|
Seasonal worsening of access |
36.1 % |
Marked summer vulnerability |
|
Interruptions during the last 30 days |
37.7 % |
Reliability is incomplete |
|
Restricted hygiene because of water problems |
59.0 % |
Hidden household costs are present |
|
Rated quality as medium or high |
88.5 % |
Overall perception is rather positive |
|
Did not receive laboratory test information |
86.9 % |
Low informational transparency |
|
Pay for water services |
90.2 % |
Formal inclusion in the payment system |
|
Would accept a 10–20 % tariff increase if service improves |
50.8 % |
Conditional willingness to pay |
Results and Discussion
The survey shows that Orlovka is not a case of complete exclusion from piped water. A total of 88.5 % of respondents reported connection to the centralized network, and 83.6 % identified indoor water as their main source of drinking water. At the level of formal infrastructure, this suggests relatively broad coverage and supports the Vodokanal director’s statement that access is close to universal across the service area [6].
However, formal access does not fully coincide with effective access. More than one third of respondents (36.1 %) reported seasonal worsening of access, and 37.7 % reported interruptions during the previous 30 days. The strongest household-level indicator of service stress is that 59.0 % stated that they at least sometimes had to restrict hygiene or domestic practices because of water-related problems. This finding is important because it captures the hidden burden of unstable supply more clearly than connection data alone.
Perceived water quality is more positive than service reliability. A total of 88.5 % rated the quality of water as medium or high, yet 86.9 % also stated that they had not received information on laboratory analyses during the previous year. This combination suggests that trust is based more on habit and everyday experience than on transparent communication. The issue is consistent with the Kara-Suu study, where monitoring existed but results were not available to users, which limited public transparency [1, pp. 867–869].
The payment results also require careful interpretation. The share of respondents who report paying for water is high (90.2 %), and 50.8 % are willing to accept a moderate tariff increase if service quality, pressure, and continuity improve. This means that resistance to payment is not absolute. Rost et al. similarly showed that reluctance to pay in Kara-Suu should not be reduced to simple unwillingness; it is closely linked to service quality, perceived benefits, and weak transparency of tariff policy [1, pp. 868–869].
The interview explains why these household problems persist. According to the director, Orlovka Vodokanal is a municipal enterprise accountable to the mayor’s office and serving Orlovka, Podgornoye, Kashka, Udarnik, part of Kemin, and a nearby farming zone. Water comes from artesian wells approximately 70–130 meters deep. The main weak point is not the source itself but the distribution network, which the director described as old and highly accident-prone [6].
The provider-side economic evidence is especially important for the article’s analytical argument. The director estimated total losses at around 60 %, reported that only about 30 % of users across the service area are covered by meters, and stated that the existing tariff covers only around 40 % of actual expenditures. He also reported more than 100 accidents per year, or roughly 210–215 emergency outings if all urgent responses are counted [6]. Together, these indicators show that the local system is financially fragile even when household payment participation appears relatively high.
These findings justify treating Orlovka as a case in which economic constraints shape drinking water access, but not as a full economic evaluation in the strict sense. The evidence supports an assessment-oriented interpretation focused on cost recovery, hidden household coping burdens, incomplete metering, high losses, and dependence on subsidies.
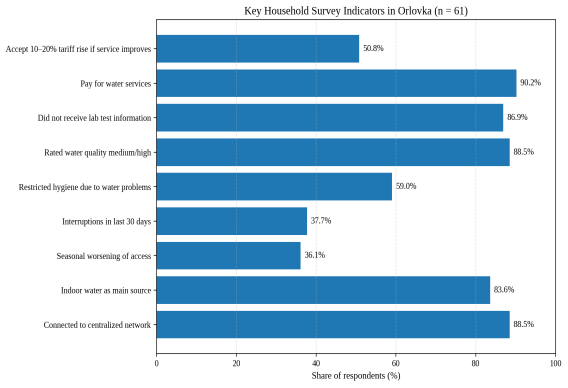
Fig. 1. Key household survey indicators in Orlovka
Table 2
Main characteristics of the water supply system according to the semi-structured interview with the Director of Orlovka Vodokanal
|
Parameter |
Characteristic |
|
Legal status |
Municipal enterprise accountable to the mayor’s office |
|
Service area |
Orlovka, Podgornoye, Kashka, Udarnik, part of Kemin, and a farming zone |
|
Water source |
Artesian wells approximately 70–130 m deep |
|
Main weak point |
Distribution network |
|
Supply regime |
Formally 24/7; interruptions mainly linked to repairs and accidents |
|
Losses |
Approximately 60 % |
|
Meter coverage |
Approximately 30 % across the service area |
|
Accidents |
More than 100 per year; about 210–215 emergency outings if all urgent cases are counted |
|
Tariff cost coverage |
Approximately 40 % of actual expenses |
|
Main priorities |
Network replacement and full meter installation |
Conclusion
The findings show that household access in Orlovka is high in formal terms because most respondents are connected to the centralized network and rely on piped water. At the same time, effective access is weaker than formal coverage suggests, because interruptions, seasonal worsening, and restrictions on hygiene remain common. The case can therefore be described as economic as well as infrastructural, but only if the economic dimension is understood as referring to cost recovery, hidden household burdens, losses, metering gaps, and the financial sustainability of the provider.
The main practical priorities for Orlovka are network rehabilitation, wider meter coverage, clearer public communication on water quality, and a more transparent link between tariff policy and service improvement. In this form, the study remains methodologically close to the Rost et al. case-study tradition, while being better aligned with the actual evidence available for Orlovka [1; 2; 3; 4; 5].
References:
- Rost, K. T., Ratfelder, G., Topbaev, O. Problems of Rural Drinking Water Supply Management in Central Kyrgyzstan: A Case Study from Kara-Suu Village, Naryn Oblast. Environmental Earth Sciences, 2015, vol. 73, pp. 863–872.
- Herrfahrdt, E., Kipping, M., Pickardt, T., Polak, M., Rohrer, C., Wolff, C. F. Water Governance in the Kyrgyz Agricultural Sector: On Its Way to Integrated Water Resource Management? Bonn: Deutsches Institut fuer Entwicklungspolitik, 2006.
- Wardle, C. Building the Capacity of Village Communities to Manage the Provision of Clean Drinking Water: Lessons from Kyrgyzstan. Oxford: INTRAC, 2010.
- Sehring, J. Water User Associations (WUAs) in Kyrgyzstan: A Case Study on Institutional Reform in Local Irrigation Management. Giessen: ZEU Discussion Paper No. 24, 2005.
- Sehring, J. Irrigation Reform in Kyrgyzstan and Tajikistan. Irrigation and Drainage Systems, 2007, vol. 21, pp. 277–290.
- Author’s household survey in Orlovka (n = 61), 2026.
- Semi-structured interview with the Director of Orlovka Vodokanal, transcript used for analysis, 2026.

