


This research analyzed the external audit services and client’s satisfaction in case KPMG Vietnam Ltd by the Exploratory Factor Analysis (EFA) and the Regression Analysis. The analysis and data validation showed that the quality of external audit service was constituted by factors: the service exchange, the social exchange and the adaption. Based on this research, the Company can evaluate the client’s satisfaction to the service’s quality and give methods to improve the service’s quality, rise the value added for clients.
Keywords: the external audit services, KPMG Vietnam Ltd, the customer’s satisfaction
The service’s quality is one of the factors that make the success of business. The quality is evaluated by the level of satisfaction or the satisfaction to demand of clients relating to products of services. External audit is an industry of professional services. The external audit industry of Vietnam has been newly developing in recent years, connects closely to the development of financial market.The valuation on the external audit service’s quality depends on the knowledgeable and experienced people in the finance field. However, the audit report is supplied to many different subjects that is based to make decisions of users, investors and managers. Thus, a qualitative audit service is a foundation of audit reports with high reliability that supply the necessary information for users.
Currently, there have been very less researches relating to external audit service’s quality and the satisfaction of clients to this kind of service in Vietnam. In the future, together with the development of financial market, the external audit plays an important role in making value added for clients’ financial statements. Especially, in the context of opening financial market that make financial statements not only used in domestic but also in worldwide, hence, the qualitative audit service needs for both investors and business. To achieve that, the audit service needs to be improved. The result of this research would help the Company to evaluate the client’s satisfaction and from that the Company can adjust to enhance the value added for clients.
The Method of research
IMP model
The interactive model of Industrial Marketing and Purchasing Group (IMP) has determined 4 factors of exchange included: the service/product exchange, the finance exchange, the information exchange, the social exchange in a relationship, and 2 long-term side of relationship (the cooperation and the adaption). The usage of IMP model to test the service’s quality of business to business is appropriate in 2 points. Firstly, this model is original from many experimental researches relating many different industries, and is constructed based on practical situations. (Hakansson và Snehota, 2000). Secondly, the model is based on a well-founded theoretical framework, IMP research is related to many different fields.
This research used the model included 6 factors: the service exchange, the information exchange, the finance exchange, the social exchange, the cooperation and the adaption that are ingredients of the service’s quality interacted to the client’s satisfaction. The suggested model is as follows:
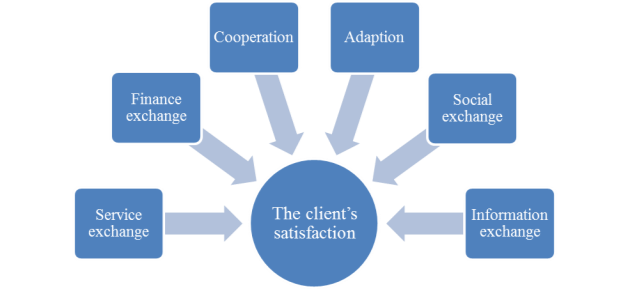
Fig. 1. The ingredients of the service’s quality interact to the client’s satisfaction
The hypothesis of model
– H1: The higher of the service exchange is the better of the client satisfaction
– H2: The higher of the information exchange is the better of the client satisfaction
– H3: The higher of the finance exchange is the better of the client satisfaction
– H4: The higher of the social exchange is the better of the client satisfaction
– H5: The higher of the cooperation is the better of the client satisfaction
– H6: The higher of the adaption is the better of the client satisfaction
Sample size of the research
To determine the sample size, the researcher used the method of convenient sample choosing. Samples were chosen from over 1.600 clients of KPMG Ltd.
According to Hair et al (1998), The best method to analyze the Exploratory Factor Analysis needs at least 5 sample units over 1 observed variable. Besides, to analyze the regression, Tabachnick & Fidel (1996) claimed that the sample size needs to follow to the formula:
n ≥ 8m + 50
In which: n: sample sizes, m: independent variables
The regression model of 29 observed variables and 6 independent variables needs the sample size as follows:
– The sample size for the Exploratory Factor Analysis is 19 x 5 = 145
– The sample size for the regression model is 8 x 6 + 50 = 98
Hence, the sample size for this research is 145.
The method of analysis
Cronbach's alpha reliability testwas used to eliminate garbage variables before performing the factor analysis. The reliability test of variables in the scale of the service’s quality and client’s satisfaction of KPMG Ltd based on the Cronbach’s Alpha test coefficient of measured variables. Variables’ the Corrected item total correlation under 0.3 was eliminated. The best reliability of scale is from 0.7–0.8. Cronbach alpha ≥ 0,60 is acceptable (Nunnally & Bernstein 1994).
Exploratory Factor Analysis — EFA:The Exploratory Factor Analysis method was used to determine groups of criteria for evaluating the audit service quality and client’s satisfaction of KPMG Vietnam. The EFA analysis method is an interdependence technique, which means that there are no dependent and independent variables that rely on correlations between variables. EFA is used to abbreviate a set k of observed variables into a set F (F
Results and Discussions
Research samples
To reach the sample size, the questionnaire was sent to 200 clients in more than 1.600 KPMG Ltd. The questionnaire was sent to the chief financial officers or chief accountants of the clients through email by in charge of the audit team. Two hundred clients are conveniently selected to cover almost all areas of business: banking, insurance, securities, investment, textiles, petroleum, food and commerce.
After more than a month sending the questionnaire and urging the clients to respond, the author received 160 replies from clients, of which 150 answered responses are full and usable. With the proportion of foreign clients accounting for the highest rate of 52 %, followed by the joint stock company, the form of joint venture accounted for a modest proportion. Most medium to large sized businesses have 98 clients with over 100 billion VND in revenue. The structure of the business sector is quite evenly distributed, with the proportion of clients in the real estate, construction, architecture, construction materials sector having the highest rate of 18 %. Client loyalty to the company's independent auditing service is not high, with a high proportion of clients using the service for one to two years, up to 20.7 %.
Preliminary assessment of scale reliability with Cronbach Alpha
The result of Cronbach Alpha coefficient test, the components of the service quality scale, has Crobach Alpha coefficients that are acceptable in terms of reliability (greater than 0.8).
Table 1
The result of Cronbach Alpha coefficient test
|
Variable symbol |
Explanation |
Scale average if variable eliminated |
Scale variance of variable eliminated |
Correlation coefficient of total variable |
Cronbach Alpha coefficient of variable eliminated |
|
DV1 |
19.8733 |
7.346 |
0.884 |
0.839 |
|
|
DV2 |
20.0000 |
7.584 |
0.832 |
0.848 |
|
|
DV3 |
20.2867 |
7.078 |
0.746 |
0.859 |
|
|
DV4 |
19.9467 |
7.769 |
0.836 |
0.850 |
|
|
DV5 |
20.0467 |
8.300 |
0.568 |
0.886 |
|
|
DV6 |
20.0133 |
7.651 |
0.489 |
0.913 |
|
|
Cronbach's Alpha =0.886 |
|||||
|
TT1 |
15.6467 |
5.116 |
0.771 |
0.917 |
|
|
TT2 |
15.5933 |
4.766 |
0.809 |
0.911 |
|
|
TT3 |
15.6667 |
5.096 |
0.855 |
0.902 |
|
|
TT4 |
15.6467 |
4.861 |
0.845 |
0.903 |
|
|
TT5 |
15.6600 |
5.246 |
0.774 |
0.917 |
|
|
Cronbach's Alpha =0.927 |
|||||
|
TC1 |
12.4667 |
2.586 |
0.755 |
0.939 |
|
|
TC2 |
12.2800 |
2.579 |
0.818 |
0.917 |
|
|
TC3 |
12.3800 |
2.412 |
0.913 |
0.886 |
|
|
TC4 |
12.3733 |
2.517 |
0.877 |
0.898 |
|
|
Cronbach's Alpha = 0.931 |
|||||
|
XH1 |
15.5933 |
5.491 |
0.726 |
0.828 |
|
|
XH2 |
15.6000 |
5.758 |
0.709 |
0.834 |
|
|
XH3 |
15.6333 |
5.777 |
0.684 |
0.839 |
|
|
XH4 |
15.5000 |
5.164 |
0.820 |
0.803 |
|
|
XH5 |
15.8333 |
5.361 |
0.556 |
0.882 |
|
|
Cronbach's Alpha =0.866 |
|||||
|
CT1 |
7.6400 |
1.896 |
0.842 |
0.908 |
|
|
CT2 |
7.8667 |
2.157 |
0.859 |
0.894 |
|
|
CT3 |
7.8400 |
2.001 |
0.865 |
0.885 |
|
|
Cronbach's Alpha =0.928 |
|||||
|
TU1 |
17.1600 |
17.384 |
0.623 |
0.927 |
|
|
TU2 |
17.4867 |
15.285 |
0.739 |
0.913 |
|
|
TU3 |
17.3200 |
15.065 |
0.753 |
0.911 |
|
|
TU4 |
17.5867 |
15.358 |
0.908 |
0.893 |
|
|
TU5 |
17.4533 |
13.766 |
0.851 |
0.898 |
|
|
TU6 |
17.5267 |
15.123 |
0.826 |
0.901 |
|
|
Cronbach's Alpha =0.922 |
|||||
|
HL1 |
7.2800 |
2.270 |
0.820 |
0.764 |
|
|
HL2 |
7.4400 |
2.329 |
0.708 |
0.848 |
|
|
HL3 |
7.4667 |
1.727 |
0.758 |
0.828 |
|
|
Cronbach's Alpha = 0.867 |
|||||
In which, the alpha coefficient of 6 components of service quality and satisfaction satisfaction: service exchange (0.886), information exchange (0.927), financial exchange (0.931), Social exchange (0.866), social interaction (0.928) and social satisfaction (0.922) and satisfaction (0.867). Considering the coefficient of correlation — the sum of the observed variables is higher than 0.30 (Hair et al., 2006), indicating that this is a good measure, so that there is no observed variable disqualified and appropriate scales used for subsequent EFA analysis.
Analysis of factors affecting the quality of external audit services
The Kaiser-Meyer-Olkin Measure of Sampling Adequation (KMO) equation of 0.813 (close to 1) indicates that the data is consistent with the factor analysis. Bartlett's Test of Sphericity states that the very small Sig value (0.000) indicates that the variables are closely related.
Table 2
The Kaiser-Meyer-Olkin Measure
|
Kaiser-Meyer-Olkin Measure of Sampling Adequacy. |
0.813 |
|
|
Bartlett's Test of Sphericity |
Approx. Chi-Square |
5162.979 |
|
Df |
406 |
|
|
Sig. |
0.000 |
|
Exploratory Factor Analysis with the Varimax rotation method, the Principal Components extraction method with the Eligenvalue > 1 standard eliminated the DV6 and TU1 variables as they had very low Extraction coefficients. They do not contribute much or do not accurately measure a factor. And, XH5 turned to measure the adaption factor. After eliminating the bad measurement variables, the factors explained 82 % of the variance of the data.
Analyzing the factors affecting client’s satisfaction
Client satisfaction scale consists of 3 observed variables HL1, HL2, HL3. These variables will be included in factor analysis to test the degree of convergence. The KMO test achieves a value of 0.720, Eigenvalue > 1, and the total variance is used to explain the factor of > 50 % (80 %) satisfying the condition of the factor analysis. Thus, the results of the customer satisfaction factor analysis show that all three variables have the load factor> 0.5 and explain that the scale of client satisfaction is reasonable.
Table 3
The results of the customer satisfaction factor analysis
|
Kaiser-Meyer-Olkin Measure of Sampling Adequacy. |
0.720 |
|
|
Bartlett's Test of Sphericity |
Approx. Chi-Square |
240.553 |
|
df |
3 |
|
|
Sig.. |
0.000 |
|
Regression analysis
The values of the observed variables in each factor are summed to form the corresponding variables for inclusion in the multiple regression model. Newly formed variables correspond to the following factors:
Table 4
Variable name identifier
|
Factor |
Variable name |
Descripion |
|
1 |
SERVICE |
Service exchange |
|
2 |
INFORMATION |
Information exchange |
|
3 |
FINANCE |
Finance exchange |
|
4 |
SOCIALITY |
Social exchange |
|
5 |
COOPERTATION |
Cooperation |
|
6 |
ADAPTION |
Adaption |
Regression mode
SATISFACTION = β0 + β1SERVICE + β2INFORMATION + β3FINANCE + β4SOCIALITY+ β5COOPERATION + β6ADAPTION + e
In which, βi is the partial regression coefficients and e is the random noise with normal distribution with mean 0 and constant variance σ2.
The Enter method is used to put variables into the model.
Table 5
Results of the first chain correlation test
|
Model |
R |
R2 |
R2 adjusted |
Estimation of standard errors |
Durbin-Watson |
|
1 |
0.774a |
0.599 |
0.582 |
0.45444 |
1.862 |
The R2 adjusted value of 0.582 showed that the independent variable explained 58.2 % variation of the dependent variable. At the same time, the Durbin-Watson value was 1,862 between 1,803 and 2,197, so the regression model had no first-order autocorrelation.
Table 6
The summarized table of the assumptions
|
Factor |
Beta |
T value |
Sig |
Conclusion |
|
Service |
0.143 |
2.256 |
0.026 |
Hypothesis H1 is not rejected |
|
Information |
0.131 |
1.443 |
0.151 |
Hypothesis H2 is rejected |
|
Finance |
0.107 |
1.757 |
0.081 |
Hypothesis H3 is rejected |
|
Sociality |
0.297 |
3.587 |
0.000 |
Hypothesis H4 is not rejected |
|
Cooperation |
0.025 |
0.312 |
0.755 |
Hypothesis H5 is rejected |
|
Adaption |
0.307 |
4.007 |
0.000 |
Hypothesis H6 is not rejected |
Partial regression coefficients are calculated from the SPSS software and are shown in the table below. The regression coefficients were hypothesized as H0: βi = 0. With a significance level of 5 %, the regression results showed that of the six factors used in the study, three factors did not affect client satisfaction with the quality of the company's independent audit services includes information exchange, financial exchanges and cooperation.
By analyzing and verifying the data, the quality of independent audit services is constituted by the factors of service exchange, social exchange and adaptation.
By analyzing and testing the data, the quality scale of independent audit services is constituted by the factors of service exchange, social exchange and adaptation.
On adaptation: This is the highest impact factor on client satisfaction (standardized beta is 0.307), which is a factor that greatly affects client satisfaction. Adaptation is a long-term investment in enhancing client satisfaction that keeps customers from using the service.
Score components in this factor are not high from 3.3 to 3.7 points, the composition of the management letter occupies the lowest score. Through quantitative and qualitative research, many clients are not provided with management letter. This is a shortcoming in enhancing long-term relationships with customers. Cause can be told when some customers have too short audit time, audit staff do not have enough time to implement the control procedures to find vulnerabilities in customer management, Management letter to the client is not a mandatory issue to provide in the audit contract as well as the audit process of the company. The low score indicates that the company needs to find a strong solution to improve
Social exchange: This component has the second highest standardized Beta factor of 0.297. Score components are relatively high. This is the result of having an audit before the company requires all staff to thoroughly study audit records in previous years in order to understand the general situation of the clients. The company also asked audit team leaders to contact their clients in advance about changes in the year before conducting field audit. Knowing information in advance helps auditors to be more confident in front of clients, avoiding unnecessary and repetitive questions.
Among the service exchange components, auditors consistently maintain contact with clients with the lowest score of 3.7 indicating that after each audit the audit staff are not yet assured. Maintain regular contact with clients, companies need to take measures to improve.
About service exchange: This factor has the third highest beta factor (0.143). Service exchange is what KPMG provides and is committed to providing clients with the components of the exchange of services mentioned in KPMG's audit contract. The scores of the components in the exchange of services are relatively high indicating that the exchange of services mostly meets the requirements of clients. This result is due to the stringent KPMG Group mandated global application process by which KPMG Vietnam is a member. Right from the moment of signing the contract with the customer, KPMG's management system allows for proper membership arrangements. Members must develop, monitor and follow the proposed schedule and budget. KPMG's auditors are constantly updated with the training programs of the entire team. Courses to gain international qualifications such as ACCA, CPA Australia, CFA, MBA are also funded by the company to improve the qualifications for employees.
In this factor, the cost-effectiveness of the audit service has the lowest mean score 3.7. Cause is explained that the company is an international auditing firm, the proposed fee is often higher than domestic companies, the proposed fee is high to ensure the objective independence of the audit staff. Mathematics for the benefits if arising from the customer. However, the lowest score among the components of this factor suggests that the company needs to take measures to improve the value added for its customers commensurate with the proposed fee.
Conclusion
As discussed above, social exchange has the greatest impact on client satisfaction. Therefore, companies must firstly focus on improving this factor.
Social exchange: In the survey of client’s satisfaction with KPMG Vietnam's independent auditing service, the social exchange factor was highly valued by clients. However, there are still a number of measures that the company can take to improve the score for this factor, such as: staffs should thoroughly study audit files in previous years to understand the business situation of clients; auditors need to demonstrate independence for the benefits that arise; after each audit, employees should maintain regular contact with clients, update them with new regulations, and help them solve problems arising in the course of their operations.
Adaptation: Quantitative research shows that the score of adaptation has not been high in part because the company has not paid much attention to this factor. To improve this factor, the company needs to do the following: to update the email system of clients to be able to continuously inform them of the new regulations of the State; The Audit Technique Department should update the new regulations in the audit report and at the same time provide training for the audit staffs to minimize the time required to complete the audit report and be able to reasonably explain to clients these changes.
Service exchange: To improve efficiency the company can build management software system for each contract from budgeting, arranging resources and schedule of project implementation; regularly organize training courses, updating professional skills; test the work attitude of the audit staff.
References:
1. Bojanic, David C. (1991). Quality Measurement in Professional Services Firms. Journal of Professonal Services Marketing, pages.27–36.
2. Boulding, William, Ajay Kalra, Richard Staelin, and Valerie A. Zeithaml (1993). A Dynamic Process Model of Service Quality: From Expectations to Behavioral Intentions. Journal of Marketing Research, pages.7–27.
3. Campbell N. C. G. (1985). An Interaction Approach to Organizational Buying Behavior. Journal of Business Research, pages.35–48.
4. Carman, James M. (1990). Consumer Perceptions of Service Quality: An Assessment of the SERVQUAL Dimensions. Journal of Retailing, pages.33–55.
5. Ford, David (1990). Introduction: EMP and the Interaction Approach, in Understanding Business Markets: Interaction, Relationships and Networks, David Ford, ed. England: Academic Press.
6. Gronroos, Christian.(1984). A Service Quality Model and Its Marketing Implications”, European Journal of Marketing.
7. Hakansson, Hakan (1982). International Marketing and Purchasing of Industrial Goods. UK: John Wiley & Sons.
8. Halinen, Aino (1996). Service Quality in Professional Business Services: A Relationship Approach. in Advances in Services Marketing and Management, VoL5.
9. Ka-shing Woo, Christine T. Ennew (2004). Measuring business-to-business professional service quality and its consequences”. Journal of Business Research.
10. Lapierre, Jozee and Pierre Filiatrault (1996). The Foundations of Research on the Quality of Professional Services to Organizations”, in Managing Service Quality, Vol. 11, Paul Kunst and Jos Lemmink, eds. London: Paul Chapman Publishing
11. Szmigin, Isabelle T. D. (1993). Managing Quality in Business-to-business Services. European Journal of Marketing.
12. Tse, David K. and Peter C. Wilton (1988). Models of Consumer Satisfaction Formation: An Extension. Journal of Marketing.
13. Venetis, Karin (1997). Service Quality Dimensions of Professional Business Services: Structure and Dynamics within Long-Term Relationships in Managing Service Quality, Vol. III, Paul Kunst and Jos Lemmink, eds. London: Paul Chapman Publishing.
