The Web-application for analyzing users opinions in social networks is developed in the thesis. The Spring framework was used as a structure of the program system. The Twitter microblog was chosen as a social network. The purpose of this work is to create a statistical tool for analysing users opinions in social networks to investigate a consumer response to any products or services. Testing and approbation of the developed solution was made on the real data.
Key words: Web-application, Twitter, Spring MVC, scalable architecture, programming
Social networks and blogs became very popular means of communication nowadays. Millions of users write their opinion about various aspects of everyday life. For this reason such services are becoming very important data sources for the extraction and analysis of opinions. Having appeared and rapidly developed rather recently (first of all it's Twitter microblogs), these systems helped to discover more and more tools for the analysis of their content. Text information can be divided into two main categories: facts and opinions. The facts are objective statements about some entities or events. Opinions are the subjective statements reflecting the person's relation or perception of some event. The bulk of existing researches about natural language processing are concentrated on factual information collection and extraction. It's traditional information search or web search in particular. But there haven't been enough researches in case of opinions handling. Various opinions are very important for either individuals, or organizations/companies. The appearance and development of the Internet, and explosive growth of the content discover new opportunities of distribution and consumption of information. Now you have an opportunity to publish feedbacks about products and to express your point of view regarding almost all the things and products in various Internet-forums, blogs and social networks. As a result we have a very big content created by all the above mentioned types of users communications. So now a consumer shouldn't ask for a reference of his neighbors, friends or relatives about a product, but could be directed by overviews placed in the Internet. Usually a company runs a research or works with focus groups to investigate a consumer response to its products or services. [1] Appearance of some tools for analysis of opinions placed in the network could definitely save your time and money. However the monitoring of millions sources is still a difficult task. There are a lot of various forums, blogs, etc. in the network, which could contain a required info. But the essential is usually spread within the information, which is not directly linked to the subject you are interested in. It's almost impossible to run some operations manually: to analyze huge data arrays, to find and extract from there the required opinions/information, and consolidate results in the appropriate and convenient format. Thus, the system of automatic collection and analysis of opinions placed in the network is required.
Methodology
The application architecture was designed using the Model-view-controller approach (MVC, «model-view-controller»). It is a software design pattern for implementing user interfaces on computers. It divides a given software application into three interconnected parts, so as to separate internal representations of information from the ways that information is presented to or accepted from the user. This design pattern is often used for creation of an architectural frame when you pass from the theory to implementation in the specific data domain.
The main application objective of this concept is the separation of business logic (model) from its visualization (view). Due to such division the possibility of reuse raises.
As with other software architectures, MVC expresses the «core of the solution» to a problem while allowing it to be adapted for each system. [2]
The central component of MVC, the model, captures the behavior of the application in terms of its problem domain, independent of the user interface.
– The model directly manages the data, logic, and rules of the application.
– A view can be any output representation of information, such as a chart or a diagram. Multiple views of the same information are possible, such as a bar chart for management and a tabular view for accountants.
– The third part, the controller, accepts input and converts it to commands for the model or view.
In addition to dividing the application into three kinds of components, the model–view–controller design defines the interactions between them.
– A model stores data that is retrieved according to commands from the controller and displayed in the view.
– A view generates new output to the user based on changes in the model.
– A controller can send commands to the model to update the model's state (e.g., editing a document). It can also send commands to its associated view to change the view's presentation of the model (e.g., by scrolling through a document).
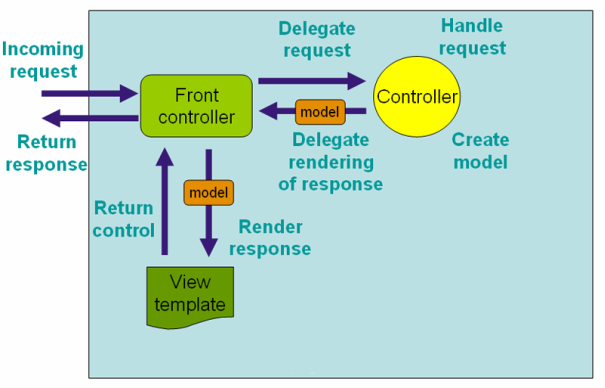
In the implementation of the required web service each request is intercepted by the global Front-controller which determines by specific parameters (URI) to what controller to transfer the received request. The controller processes the request and creates model. The Front-controller fills the view with the model data and returns the received result to the browser. The diagram of the request processing in Spring on the picture 1 is given below.

Fig. 1. The diagram of the request processing in Spring
The web service was implemented using the classical algorithm called Word Count. The task is formulated as follows: there is a large number of tweets. We check each tweet for the existence of the specific keyword: we look for an index i of the first entrance of substring in a tweet line — if an index non-negative, then we increment the counter. Further we look for an index of the following keyword appearance since the i+1 item, incrementing the counter in case of success. After analyzing all the tweet, the number of keyword detection in it is added with its quantity in the previous already viewed tweets.
Twitter has a restriction of requests amount because of probability of the excessive load on their servers. Therefore the solution with data cached in the memory was developed.
Experiment
The developed application obtains input data: the number of accounts for the analysis and the list of keywords. The Twitter programming interface is called to select data. So the request redirects to the Twitter API. Further the subscribers of the fixed user are boot. The user of Barack Obama was used because of the big amount of his subscribers.
Accidental subscribers are selected, all their tweets are booted by 200 pieces per call since the Twitter API has a limit on a single request of the messages boot. [3] Then all the tweets are being analysed on existence of the entered keywords with the Word Count algorithm. As a result the pie chart with analysis results is displayed.
For creation of a web service the following units were designed and implemented:
- The REST-client for connection to a backend.
The REST client is filled automatically with Spring framework, using settings for the appendix where the backend address is specified. The client sends the HTTP GET request on the backend service URI with the parameters entered by the user — number of accounts for the analysis and keywords. Also the client receives the response in the JSON format, transferring it to a collection with words and their quantity among the analyzed accounts.
- Web-service controller (Front-controller)
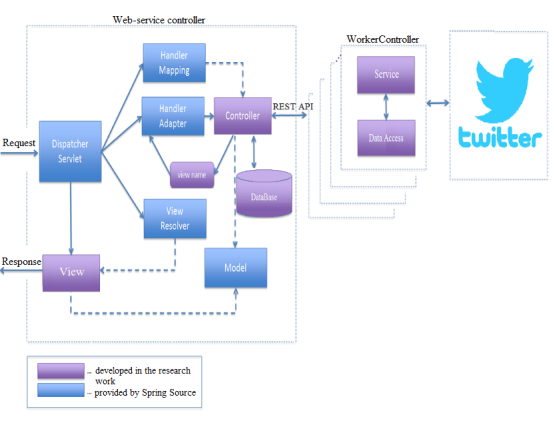
This is the main controller of a Spring MVC framework. It is loaded with the start of the application and automatically sets the URI whereby the REST client will be connected for communication with the backend. When the web-service is started the client locates at the address "/" — in this case Front-controller won't receive data from a backend therefore the empty request is used. After entering of input parameters by the user and sending the form with these data the client is redirected to the address "/load-request». Then the controller receives a request for the analysis, transfers it to the backend, takes the received model and fills the view with data received, builds the chart by results.
- Working service controller (WorkerController)
This controller receives the number of accounts which are had to be analyzed, and the keywords coming from the Front-controller after the REST-client query with parameters. The controller loads tweets by 200 pieces per call, reads words and gives result to the web, responds in the json format.
Results and discussion
Approbation of the developed web-application on real data was carried out. Several brands from one category were chosen for their handling by the service. The number of references of each brand in «interviewed» users tweets was returned at the exit. Thus, this service makes the comparative analysis of brands popularity in the microblog that corresponds to a state of affairs in a real life.
Also operation performance of application was checked. The different number of the analyzed accounts was entered. The maximum number of users, whose tweets were used, was 500 until the program fell. It's not enough for such a service. But the number of successfully processed information sharply increases after deployment the service in the cloud infrastructures.
The request lifecycle of the developed application is presented on the picture 2.

Fig. 2. The request lifecycle of the developed application
Conclusion
Within this thesis the following results were received:
– The program system performing the analysis of messages in the microblog and issuing the report in graphical representation is created.
– The scaleable architecture for deployment of service in cloud infrastructures is constructed.
– Testing and approbation of web-service on real data is held.
Efficiency of using a design pattern in case of which the application was divided into three components was shown. It allows to create scaleable architecture for handling large volumes of data.
Further it is planned to realize an algorithm of thenbrands assessment depending on emotional coloring of users messages.
References:
1. K. Cukier and V. Mayer-Schonberger. Big Data: A Revolution That Will Transform How We Live, Work, and Think. Eamon Dolan/Mariner Books, 2014.
2. R. Johnson and J. Hoeller. Spring Framework Reference Documentation, 2016.
3. Inc. Twitter Developer Documentation, 2016.

