Соединения группы I-III-VI 2 , кристаллизуется в структурах с тетраэдрической координацией атомов, причем тетрагональная и орторомбическая сингонии этих соединений близки к псевдокубической структуре. Ширина запрещенной зоны тройных полупроводников I-III-VI 2 изменяется от 1 до 3,5 эВ, что несколько ниже, чем у электронных бинарных аналогов II-VI. В отличие от соединений II-VI, обладающих, как правило, устойчивым типом проводимости.
Ключевые слова: тройные соединения, фотолюминесценция монокристалла, поглощения подложки. оптическая возбуждения, возбуждения кристалла, монокристаллическое соединение, лазерный излучения, коэффициент поглощения, спектры тонких пленок .
It is noted in the literature [1] that ternary chalcogenides of the I-III-VI 2 type are considered to be actively luminescent semiconductors, and this assumption has been confirmed experimentally for some compounds in this class.
Despite the fact that this compound has been studied extensively compared to other compounds in the I-III-VI 2 class, no one has studied its luminescence properties. A study of radiative recombination could expand and clarify some understanding of the physical properties of CuInSe 2 .
Optical excitation of single-crystal and polycrystalline CuInSe 2 was performed using an “LTI-701” solid-state laser. The following laser pulse parameters were selected:
— wavelength λ = 0.535 μm;
— pulse duration 5 μs;
— repetition rate 8 kHz;
— beam diameter 1 mm;
— average radiation power 0.8–2 W.
Since this wavelength of radiation falls within the crystal's intrinsic absorption region, it's clear that most of the energy is absorbed at the surface. For normal beam incidence, we calculate the beam penetration depth using the formula:

Where I 0 — is the intensity of the incident beam, I — is the intensity of the passing daylight beam, α — is the absorption coefficient, and d — is the penetration length.
The intensity of the incident beam is equal to

where W — radiation power, hν — photon energy, n — laser pulse frequency.
Assuming that W = 2 W, n=8000 c -1 , hν = 3.7∙10 -19 J, then I = 6.7∙10 14 .
So, each fully absorbed pulse can generate ~ 10 14 free nonequilibrium carriers. In order for the intensity of the beam to decrease by four orders of magnitude as a result of absorption, it is necessary for the beam to penetrate to the depth of the crystal up to 1 μm . At the same time, the absorption coefficient is taken to be equal to 10 5 cm -1 . Based on the obtained value of the depth of penetration, we will observe both surface and bulk recombination radiation. On the other hand, after each excitation of the crystal, a complete relaxation of non-equilibrium carriers occurs, and then the second optical excitation follows, etc.
Typical spectra of photoluminescence (fig.1) monocrystalline and polycrystalline CuInSe 2 thin films were photographed in the mode of measuring the luminescence from the reflective surface of the excitation radiation. The spectrum of radiation of a monocrystalline CuInSe 2 sample covers the 0.98÷1.8 eV energy interval of electromagnetic radiation. Emissive recombination transitions are interband. As is known from theory, the width of the forbidden band during interband radiative recombination is related to the maximum band of intrinsic radiation

Then, taking the energy of 1.031 eV as the corresponding maximum of the self-radiation band, we find E g =1.023 eV . This value is slightly larger than the corresponding value found from absorption measurements ( 0.94 eV ). In the interval 1.03÷1.39 eV , nine peaks associated with different radiation bands were observed. We failed to find out the mechanisms of recombination expressed by these peaks, because the intensity of the radiation is so weak that it is not possible to investigate the dependence of the intensity of the radiation on the temperature and the level of excitation. From the analysis of the absorption spectra, depressions in the spectra around 1.4 eV were found. In this same part of the photoluminescence spectrum, we detect a radiation band with a maximum peak at 1.39 eV [2,3].
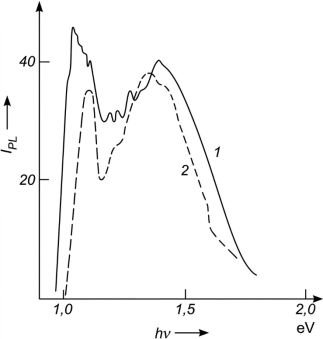
Fig. 1. Typical photoluminescence spectra of single crystals (1) and polycrystalline thin film (2) CuInSe 2
Spectrum (curve 2) photoluminescence polycrystalline thin films of CuInSe 2 , grown on glass, are found in accordance with the radiation spectrum of a single crystal sample. Obviously, the measurement of photoluminescence of thin films at a high level of excitation is associated with many problems. Some of these problems have been solved by us thanks to the design of the crystal holder and the technical characteristics of the “LTI-701” laser installation. In contrast to the method of measuring photoluminescence in a large sample of CuInSe 2 , in thin films, the power of the excitation radiation did not exceed 0.8 W , which allowed to avoid heating of the thin film [4].
It can be seen from curve 2 that the long wave edge of the spectrum is shifted towards high energies compared to spectrum 1. The peak of the first band is located at 1.102 eV . In addition, peaks at 1.35 and 1.405 eV can be distinguished [5].

Fig. 2. Spectral dependence of the absorption coefficient in a thin film of CuInSe 2 ; 1–300K; 2–165K
However, somewhat more precise energy values characterizing the band structure of the compound can be extracted from the α(h ν) spectrum in thin films ~ 40 μm thick. Figure 2 shows the spectral dependence of the absorption coefficient in a 38 μm -thick CuInSe 2 film grown on glass. The spectrum was calculated taking into account the absorption spectrum of the substrate, but ignoring the reflectance spectrum. As a rule, the latter is often taken into account by measuring the absorption spectrum of films of different thicknesses.
In the thin films we obtained, we also found that, at certain thicknesses, the absorption spectrum depends significantly on the film thickness, with the absorption coefficient in the fundamental absorption region increasing with increasing film thickness. The choice of the presented spectrum from those studied was based on the fact that, when fabricating optoelectric devices based on thin CuInSe 2 layers, films with a thickness of 8–15 μm were most suitable for us. As can be seen from the α (h ν) dependence at temperatures of 300 K and 165 K , the fundamental absorption edge is formed in the quantum energy range of 0.9–1.0 eV . However, determining the exact value of the band gap and other characteristic energy values characterizing the bands in these spectra presents difficulties.
An extreme maximum is observed in the spectrum at approximately 1.2 eV, reflecting an optical transition of electrons from the subband formed by the spin-orbit splitting of the valence band. This result is in good agreement with the results of the authors of the study. A second extreme maximum is observed at approximately 1.5 eV. However, no explanation for such an optical transition in CuInSe 2 has been found in the literature. In principle, the spectra of thin films of CuInSe 2 presented by us are consistent with the spectra of this compound studied prior to our work. This result provides essential proof that the composition of the films obtained stoichiometrically corresponds to that of CuInSe 2 [6].
It was found that adding up to 1 % selenium to the starting material produces photosensitive films of Cu 3 In 5 Se 2 . The intensities of the photoluminescence bands of these films are enhanced in comparison with the analogous luminescence bands of films of the pure compound.
References:
- Керимова Э. М. Кристаллофизика низкоразмерных халькогенидов. Из.-во Элм, Баку, 2012, 712 с.
- Керимова Э. М., Мустафаева С. Н., Джаббаров А. И. Температурные зависимости проводимости, термоэдс и теплоемкости TlCoS 2 , Физика низких температур. 2004, т.4, с.395.
- Пашаев А. Н. Фотолюминесценции наночастиц, твердого раствора (Ca 2 S 2 ) (Eu 2 O 2 ), Журнал прикладной спектроскопии, 2011, т.78, № 2, с.288–292.
- Керимова Э. М., Мустафаева С. Н., Температурные зависимости проводимости, термоэдс и теплоемкости TlInSe, Физика низких температур. 2002, т.2, с.212–215.
- Мустафаева С. Н., Керимова Э. М., Перенос заряда в TlInSe, TlFeS 2 , ФТТ, 2001, т.43, № 3, с.427–430.
- Тагиев О. Б., Абушов С. А., Люминесценция активированных ионами Eu 2+ и Ge 2- кристаллов BaGa 2 Se 4 // ЖТФ, 2010, т.77, с.124–126.