Introduction
During the period 2021–2025, Vietnam has introduced numerous policies and initiatives to develop domestic credit cards, aiming to support the implementation of the “Cashless Payment Development Project in Vietnam for 2021–2025.” However, in practice, the pace of credit card issuance, despite significant growth, remains disproportionate to the market potential. According to data from the State Bank of Vietnam (2023), by the end of 2022, over 5.5 million domestic and international credit cards had been issued nationwide, representing only a small fraction of nearly 110 million bank cards in circulation. Moreover, the actual usage rate of credit cards remains low, with many cards issued but not activated or generating few transactions. Notably, statistics from the State Bank of Vietnam indicate that cardholder misconduct in credit card usage continues to occur frequently. Therefore, studying the factors that influence proper credit card usage behavior is a matter of practical urgency.
From a theoretical perspective, perceived risk has been recognized as one of the key factors affecting consumer behavior (Bauer, 1960; Cunningham, 1967). Featherman and Pavlou (2003) also pointed out that when perceived risk is high, consumers tend to limit or delay their actions. For credit cards—a financial product associated with concerns about bad debt, hidden costs, and fraud—the role of risk perception is particularly critical in determining cardholders’ usage behavior.
For these reasons, the study entitled “The Impact of Risk Perception Factors on Cardholders’ Proper Use of Credit Cards: A Typical Study in Hanoi” holds practical significance both theoretically and empirically. The findings not only help fill gaps in the finance and banking literature but also have high practical value, assisting banks and regulatory agencies in developing strategies to promote credit card usage, limit informal credit, and foster the development of the digital economy in Vietnam.
Literature Review and Theoretical Foundation
1. Literature Review
Research on credit card usage behavior has been developed based on multiple theoretical foundations. The Theory of Reasoned Action (TRA) by Fishbein (1967) and Ajzen & Fishbein (1975, 1980) explains the relationship between human attitudes and behavior, suggesting that behavioral intention—shaped by attitudes and subjective norms—is the determinant of actual behavior. In addition, compulsive buying behavior has been analyzed by many scholars, who argue that overconsumption often stems from internal psychological factors such as anxiety and stress, which may develop into addictive behavior. In many studies, credit card usage is considered a moderating variable that clarifies the relationship between money-related attitudes and compulsive buying behavior. Classical behavior theory further supports this argument by emphasizing the effect of stimuli (S) on responses (R) and behavior (B), thereby illustrating the mechanism that forms, reinforces, or restricts consumer behaviors.
In empirical research, Meidan and Davos (1994) argued that convenience, reputation, security, and the ability to spend abroad are key determinants of credit card usage behavior. Chebal, Laroche, and Malette (1988) analyzed cultural differences in attitudes toward credit cards, indicating that cost, safety, and overconsumption risk significantly affect behavior. More recently, Wei Nai et al. (2021) used time-series data to model credit card usage behavior by age, showing significant differences among customer groups. In Vietnam, Bùi Văn Thụy et al. (2021) confirmed that banking policies, consumer attitudes, cashless payment trends, and usage costs are positively associated with credit card usage behavior in e-commerce.
From these findings, it can be seen that research on credit card usage behavior has been conducted along various directions, focusing on convenience, cost, banking policies, or socio-cultural characteristics. However, a gap remains due to the lack of in-depth studies on the impact of risk perception on credit card usage. Some studies mention this factor but only at a general level or within narrow contexts. Therefore, analyzing the impact of risk perception—especially among residents of Hanoi, where banking service usage is high—can contribute to strengthening the theoretical foundation and has practical significance in proposing measures to promote proper credit card usage and expand cashless payment adoption.
2. Theoretical Foundation
Credit card: Acredit card is “a card that allows the cardholder to perform transactions within a credit limit granted according to the agreement with the issuing institution” (State Bank of Vietnam, 2023).
Credit card risk : Credit card risk refers to the potential occurrence of financial, privacy, security, time, or psychological losses associated with using a credit card, which reduces the expected benefits for the user. Credit card risk can be categorized into seven main types: financial risk, security risk, privacy risk, performance/transaction risk, psychological risk, time risk, and social risk.
Perceived risk: Perceived risk is a concept in psychology and consumer behavior that refers to the degree to which an individual feels concerned or uncertain about potential negative consequences when performing an action or making a decision.
Credit card usage behavior :
Credit card usage behavior is defined as the goal-directed response of consumers to stimuli from the financial environment—such as banking policies, product utility, usage costs, and social influence—in order to carry out transactions, withdraw cash, or manage expenditures (Bauer, 1960; Ajzen, 1991; Ajzen & Fishbein, 1975).
Permitted (Proper) and Prohibited (Improper) Credit Card Usage Behaviors:
Proper credit card usage : Using the card to pay for goods and services; depositing or withdrawing cash according to the agreement between the cardholder and the issuing institution; not using the credit card to transfer funds (or credit) to payment accounts, debit cards, or prepaid cards.
Improper credit card usage : Creating, using, transferring, or circulating counterfeit cards; performing, organizing, or facilitating fraudulent or forged card transactions; conducting false payment transactions at merchant locations; using the card for money laundering, terrorist financing, scams, fraud, or other illegal activities.
Research Model and Methodology
1. Research Model
This study is based on the S → R → B behavior model and social behavior theories (TRA, TPB). Accordingly, stimuli (S) such as banking policies, product utility, usage costs, and social trends influence customers’ cognition, attitudes, and responses (R), which in turn shape or modify credit card usage behavior (B). Based on this analytical framework, the research factors are argued as follows:
Banking Policies (BP) are external factors that directly affect the intention and behavior of credit card usage. Factors such as credit limits, interest rates, billing cycles, cashback incentives, and dispute resolution mechanisms serve as reinforcement in behavior: favorable and transparent policies strengthen trust and encourage continued usage, whereas complex or unattractive policies reduce intention. Therefore, it is hypothesized that banking policies have a positive effect on credit card usage behavior under favorable conditions.
Utility (UT) reflects perceived benefits and reduced transaction costs provided by credit cards. Features such as safety, security, payment flexibility, and expense management through statements help reduce psychological barriers and promote habitual usage. Theoretically, this aligns with the concept of “usefulness” in technology acceptance models. Hence, utility is expected to have a positive effect on credit card usage behavior.
Usage Costs (UC) act as a barrier factor. Fees such as annual fees, cash withdrawal fees, late payment fees, over-limit fees, and foreign currency conversion fees increase perceived financial risk and reduce the economic benefits of card usage. From a behavioral perspective, costs serve as negative reinforcement, making the behavior less likely to be repeated. Therefore, usage costs are expected to have a negative effect on credit card usage behavior.
Social Trends (ST) represent subjective norms in TPB, reflecting the influence of friends, family, and the social environment on behavioral intention. When card usage becomes a social trend or norm, individuals are more likely to accept and use credit cards. Conversely, negative public opinion may reduce usage behavior. Therefore, social trends are expected to have a positive effect on proper credit card usage, especially when the community encourages and considers it a civilized payment method.
Risk Perception (RP) plays a central role in the model framework, representing the individual’s internal response (R) to stimuli (S). RP includes components such as financial risk, security risk, privacy risk, performance risk, psychological risk, time risk, and social risk. Overall, RP has a direct negative effect on intention and credit card usage behavior due to concerns that reduce the demand for usage. Simultaneously, RP may act as a mediator or moderator. As a mediator, policies or utility may influence RP (e.g., good security policies reduce perceived risk), thereby indirectly affecting behavior. As a moderator, high perceived risk can weaken the positive effects of policies or utility on behavior.
Based on the above arguments, the study formulates the following hypotheses:
H1: Banking policies positively influence proper credit card usage behavior.
H2: Utility positively influences proper credit card usage behavior.
H3: Usage costs negatively influence proper credit card usage behavior.
H4: Social trends positively influence proper credit card usage behavior.
H5: Risk perception negatively influences proper credit card usage behavior.
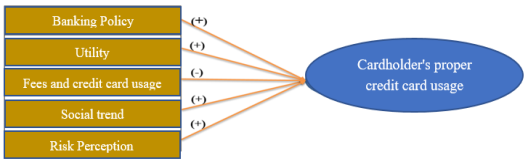
Fig. 1. Research Model
Research Methodology
The study was conducted in two phases: qualitative and quantitative, with the primary focus on survey data analysis. First, the qualitative approach was employed to synthesize previous studies and reports related to risk perception and credit card usage behavior, thereby constructing the theoretical framework and research model. Next, the quantitative approach was implemented through a survey questionnaire designed on Google Form, consisting of two parts: (i) information on the history of credit card usage; and (ii) assessment of factors affecting credit card usage behavior using a 5-point Likert scale, ranging from “1: strongly disagree” to “5: strongly agree.”
A total of 190 questionnaires were distributed to students, workers, and employees in Hanoi, of which 172 valid responses were analyzed after excluding 18 incomplete or invalid questionnaires. Data were processed using SPSS 20, following these steps: reliability testing of scales with Cronbach’s Alpha (≥ 0.6), exploratory factor analysis (EFA), multiple linear regression, and model diagnostics. This approach ensures both the reliability and representativeness of the sample while enabling the identification of the impact level of each factor, particularly risk perception, on credit card usage behavior among residents in Hanoi.
Research Results
1. Characteristics of the Survey Sample
The study sample consisted of 190 questionnaires distributed to residents living and working in Hanoi. After excluding 18 incomplete or invalid responses, the final sample comprised 172 completed questionnaires for analysis. The sample was categorized based on credit card usage history and respondent groups.
Regarding credit card usage history, 43.6 % of respondents were current credit card users, 22.8 % were awaiting card issuance, 11.4 % had used a card in the past, and 22.3 % had never used a credit card. This indicates that the majority of the sample had direct experience with credit cards, reflecting actual usage behavior and perception.
In terms of respondent groups, 57.9 % were working adults, 39.6 % were students, 2 % were retirees, and 0.5 % belonged to other categories. This demonstrates that the survey primarily targeted working adults and students—groups with a high likelihood of credit card usage and capable of providing practical insights into credit card consumption behavior.
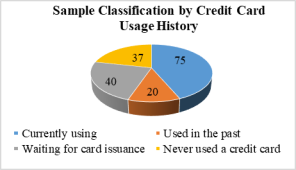
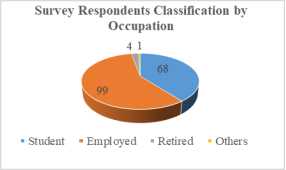
Fig. 2. Characteristics of the survey sample
2. Model validation
Table 1
Coding of the measurement scales for the research factors
|
No. |
Scale Coding |
Description |
|
I |
CS — Banking Policies | |
|
1 |
CS1 |
Variable measuring knowledge of banking policies |
|
2 |
CS2 |
Variable measuring perception of overdue interest rates |
|
3 |
CS3 |
Variable measuring perception of credit card limits |
|
4 |
CS4 |
Variable measuring perception of card usage interest rates |
|
5 |
CS5 |
Variable measuring perception of payment deadlines |
|
6 |
CS6 |
Variable measuring perception of bank incentives |
|
II |
TI — Utility | |
|
1 |
TI1 |
Variables measuring convenience of card usage |
|
2 |
TI2 |
Variables measuring the ability to make quick and easy payments |
|
3 |
TI3 |
Variables measuring the impact of promotions on usage behavior |
|
4 |
TI4 |
Variables measuring the ability to manage spending |
|
III |
CP — Usage Costs | |
|
1 |
CP1 |
Variable measuring awareness of over-limit fee |
|
2 |
CP2 |
Variable measuring awareness of late payment fee |
|
3 |
CP3 |
Variable measuring awareness of cash withdrawal fee |
|
4 |
CP4 |
Variable measuring awareness of third-party cash withdrawal fee |
|
IV |
XH — Social Trends | |
|
1 |
XH1 |
Variable measuring awareness of card usage trend |
|
2 |
XH2 |
Variable measuring social acceptance |
|
V |
NTRR — Risk Perception | |
|
1 |
NTRR1 |
Variable measuring awareness of security risk |
|
2 |
NTRR2 |
Variable measuring awareness of reputational risk |
|
3 |
NTRR3 |
Variable measuring response to service disruption risk |
|
4 |
NTRR4 |
Variable measuring awareness of personal financial risk |
|
5 |
NTRR5 |
Variable measuring awareness of credit limit risk |
|
6 |
NTRR6 |
Variable measuring behavior in coping with financial risk |
|
7 |
NTRR7 |
Variable measuring behavior in accepting cost-related risk |
Source: Compiled by the author
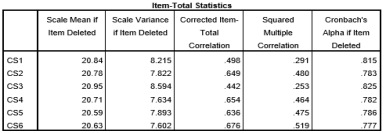
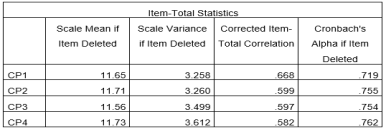
To test the reliability of the factors influencing the proper use of credit cards, the study employs Cronbach’s alpha in combination with the corrected item–total correlation. Variables are considered reliable when Cronbach’s alpha > 0.6 and the corrected item–total correlation > 0.3 (Nunnally & Bernstein, 1994, cited in Nguyễn Đình Thọ, 2009). Variables that do not meet these two conditions are excluded from the EFA analysis. In some cases, variables that are theoretically meaningful in previous studies but have a “Cronbach’s Alpha if Item Deleted” value greater than the group’s Cronbach’s alpha are also considered for removal. The results of the Cronbach’s alpha analysis for the factors are presented as follows:
2.1. Testing Cronbach’s Alpha
Table 2
Cronbach’s Alpha Test Results
|
CS — Banking policy | |
|
|
|
|
TI — Utilities | |
|
|
|
|
CP — Card usage fee and expense | |
|
|
|
|
XHXH — Social trends | |
|
|
|
|
NTRR — Risk awareness | |
|
|
|
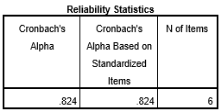
Source: Data analyzed with SPSS 20.0 to compute Cronbach’s Alpha
The results of reliability testing using Cronbach’s Alpha indicate that all factors in the study achieved an acceptable level of reliability, with Cronbach’s Alpha coefficients greater than 0.6 and all observed variables showing corrected item–total correlations above 0.3.
Specifically, the factor Bank Policy achieved a Cronbach’s Alpha of 0.824. The variable CS3 (“Credit card limit”) had the lowest corrected item–total correlation (0.442). When this variable was removed, the Cronbach’s Alpha slightly increased to 0.825; therefore, CS3 was excluded to enhance the internal consistency of the factor.
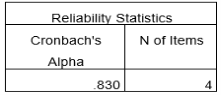
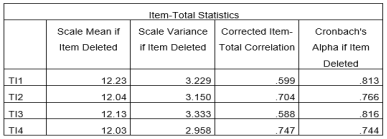
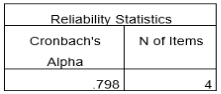
The factor Usefulness recorded a Cronbach’s Alpha of 0.830, with observed variables showing corrected item–total correlations ranging from 0.588 to 0.747, confirming strong reliability. The factor Usage Expenses achieved 0.798, with observed variables having corrected item–total correlations between 0.582 and 0.668, reflecting acceptable reliability.
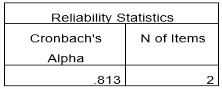
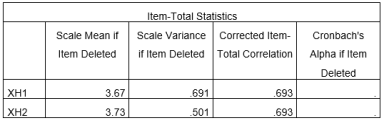
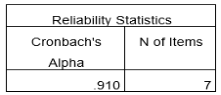
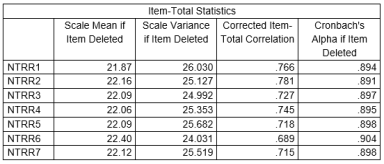
The factor Social Trend achieved a Cronbach’s Alpha of 0.813, with both observed variables presenting corrected item–total correlations of 0.693, indicating good consistency. Notably, the factor Perceived Risk reached a Cronbach’s Alpha of 0.91, with observed variables showing corrected item–total correlations ranging from 0.689 to 0.781, demonstrating excellent reliability.
Overall, the reliability test results confirm that all measurement scales in the study meet the required standards, with only variable CS3 being removed to optimize the internal consistency of the Bank Policy factor.
2.2. Exploratory Factor Analysis (EFA)
After testing the reliability of the measurement scales, variables CS3 and CS1 did not meet the required standards and were therefore excluded from the model. Exploratory Factor Analysis (EFA) was then conducted on the remaining 22 observed variables.
The results show that the KMO coefficient equals 0.793 (satisfying the condition 0.5 ≤ KMO ≤ 1) and the Sig. value equals 0.000 (< 0.05), indicating sufficient correlations among variables and the suitability for factor analysis. The extracted variance is 64.313 %, suggesting that four factors explain most of the data variation. Additionally, the eigenvalue equals 2.489 (> 1), confirming the validity of the factors.
Table 3
Results of Exploratory Factor Analysis (EFA)
|
Rotated Component Matrix a | ||||
|
Component | ||||
|
NTRR (S1) |
CP, XH (S2) |
CS (S3) |
TI (S4) | |
|
NTRR2 |
.847 | |||
|
NTRR1 |
.837 | |||
|
NTRR4 |
.826 | |||
|
NTRR5 |
.803 | |||
|
NTRR3 |
.797 | |||
|
NTRR7 |
.785 | |||
|
NTRR6 |
.765 | |||
|
CP4 |
.808 | |||
|
XH1 |
.808 | |||
|
CP1 |
.760 | |||
|
CP2 |
.749 | |||
|
XH2 |
.742 | |||
|
CP3 |
.650 | |||
|
CS6 |
.822 | |||
|
CS4 |
.808 | |||
|
CS5 |
.800 | |||
|
CS2 |
.763 | |||
|
CS1 |
.626 | |||
|
TI4 |
.871 | |||
|
TI2 |
.849 | |||
|
TI1 |
.764 | |||
|
TI3 |
.762 | |||
|
Extraction Method: Principal Component Analysis. Rotation Method: Varimax with Kaiser Normalization. | ||||
|
a. Rotation converged in 4 iterations. | ||||
Source: Results of Exploratory Factor Analysis (EFA) conducted with SPSS 20.0
The rotated component matrix identifies four main factors, including Risk Perception (S1), Cost and Social Trends (S2), Banking Policy (S3), and Utility (S4), measured by 22 observed variables. The Cronbach’s Alpha coefficients of the factors after EFA are all greater than 0.6, and the corrected item-total correlations are above 0.3, indicating that the measurement scales are highly reliable. Based on these results, the research hypotheses are formulated as follows:
H1 : Risk perception has a positive impact on the proper use of credit cards.
H2 : Usage cost and social trends have a negative impact on the proper use of credit cards.
H3 : Banking policies have a positive impact on the proper use of credit cards.
H4 : Credit card utility has a positive impact on the proper use of credit cards.
3. Correlation Analysis
Table 4
Results of Correlation Analysis
|
Correlations | ||||||
|
F1 |
S1 |
S2 |
S3 |
S4 | ||
|
F1 |
Pearson Correlation |
1 |
.705 ** |
.524 ** |
.370 ** |
.223 ** |
|
Sig. (2-tailed) |
.000 |
.000 |
.000 |
.003 | ||
|
N |
172 |
172 |
172 |
172 |
172 | |
|
S1 |
Pearson Correlation |
.705 ** |
1 |
.053 |
-.114 |
-.088 |
|
Sig. (2-tailed) |
.000 |
.492 |
.138 |
.252 | ||
|
N |
172 |
172 |
172 |
172 |
172 | |
|
S2 |
Pearson Correlation |
.524 ** |
.053 |
1 |
.079 |
-.012 |
|
Sig. (2-tailed) |
.000 |
.492 |
.304 |
.879 | ||
|
N |
172 |
172 |
172 |
172 |
172 | |
|
S3 |
Pearson Correlation |
.370 ** |
-.114 |
.079 |
1 |
-.005 |
|
Sig. (2-tailed) |
.000 |
.138 |
.304 |
.948 | ||
|
N |
172 |
172 |
172 |
172 |
172 | |
|
S4 |
Pearson Correlation |
.223 ** |
-.088 |
-.012 |
-.005 |
1 |
|
Sig. (2-tailed) |
.003 |
.252 |
.879 |
.948 | ||
|
N |
172 |
172 |
172 |
172 |
172 | |
|
**. Correlation is significant at the 0.01 level (2-tailed). | ||||||
Source: Data analyzed using SPSS 20.0 for correlation analysis
The results of the correlation analysis using Pearson’s coefficient show that the factors constituting the measurement scales are all related to customers’ behavior of using credit cards for the right purposes. According to Table 3.12, most factors have correlation coefficients r > 0.3 , while Sig. < 0.05 , indicating that these correlations are statistically significant. In particular, the factor Convenience has a correlation coefficient of r = 0.223 , which is lower than the 0.3 threshold, showing a weaker correlation compared to other factors. Overall, the results confirm that most independent factors are strongly associated with the dependent variable, consistent with the correlation analysis conditions suggested by Nunnally & Bernstein (1994, cited in Nguyễn Đình Thọ, 2009).
4. Regression Analysis Results
Table 5
Regression analysis results evaluating model fit
|
Model Summary b | |||||
|
Model |
R |
R Square |
Adjusted R Square |
Std. Error of the Estimate |
Durbin-Watson |
|
1 |
.996 a |
.993 |
.993 |
.02910 |
1.887 |
|
a. Predictors: (Constant), S4, S3, S2, S1 | |||||
|
b. Dependent Variable: F1 | |||||
Source: Data analyzed using SPSS 20.0
Multivariate regression analysis was evaluated based on criteria such as R², adjusted R², F-test, VIF coefficients, and standardized Beta coefficients (Hair et al., 2006, cited in Võ Minh Sang, 2015). The results indicate that the model achieved R = 0.996, R² = 0.993, and adjusted R² = 0.993, meaning that 99.3 % of the variation in the proper use of credit cards is explained by the independent variables in the model. The small standard error of estimate (0.02910) and a Durbin–Watson coefficient of 1.887 suggest no autocorrelation issues.
Table 6
ANOVA Analysis Results
|
ANOVA a | ||||||
|
Model |
Sum of Squares |
df |
Mean Square |
F |
Sig. | |
|
1 |
Regression |
19.178 |
4 |
4.794 |
5662.771 |
.000 b |
|
Residual |
.141 |
167 |
.001 | |||
|
Total |
19.319 |
171 | ||||
|
a. Dependent Variable: F1 | ||||||
|
b. Predictors: (Constant), S4, S3, S2, S1 | ||||||
Source: Data analyzed using SPSS 20.0
ANOVA analysis shows that the F-value = 5662.771 with Sig. = 0.000 < 0.05, confirming that the independent variables have a statistically significant effect on the dependent variable. The VIF coefficients of all variables are < 2, indicating no multicollinearity. Thus, the multiple regression model demonstrates high goodness-of-fit, statistical significance, and clear impacts of the independent variables on customers’ proper use of credit cards.
Table 7
Regression Analysis Results
|
Coefficients a | ||||||||
|
Model |
Unstandardized Coefficients |
Standardized Coefficients |
t |
Sig. |
Collinearity Statistics | |||
|
B |
Std. Error |
Beta |
Tolerance |
VIF | ||||
|
1 |
(Constant) |
.049 |
.029 |
1.674 |
.096 | |||
|
S1 |
.305 |
.003 |
.755 |
112.686 |
.000 |
.976 |
1.025 | |
|
S2 |
.267 |
.004 |
.455 |
68.329 |
.000 |
.990 |
1.010 | |
|
S3 |
.241 |
.004 |
.421 |
62.964 |
.000 |
.980 |
1.021 | |
|
S4 |
.173 |
.004 |
.296 |
44.585 |
.000 |
.992 |
1.008 | |
|
a. Dependent Variable: F1 | ||||||||
Source: Data analyzed using SPSS 20.0
The results of the multiple regression analysis indicate that all independent variables—S1 (Risk Perception), S2 (Cost and Social Trend), S3 (Bank Policy), and S4 (Utility)—have Sig. = 0.000 < 0.05, meaning they are statistically significant and positively associated with the proper use of credit cards. The standardized Beta coefficients show the descending order of influence as follows: S1 (0.755), S2 (0.455), S3 (0.421), and S4 (0.296). The VIF values of all variables are < 2, confirming no multicollinearity. The standardized regression equation is defined as:
F = 0.049 + 0.305S1 + 0.267S2 + 0.241S3 + 0.173S4 + Ei
These findings confirm hypotheses H1, H3, and H4, while rejecting hypothesis H2, affirming that all independent variables positively influence customers’ proper use of credit cards.
Recommendations for enhancing awareness of proper credit card usage
The research findings on factors influencing credit card usage behavior indicate that risk perception, cost–social factors, card policies, and utility significantly affect customers’ usage patterns. However, the survey also reveals that many cardholders do not fully understand the risks, costs, benefits, and utilities associated with credit cards, leading to improper or suboptimal usage. Therefore, it is essential to develop solutions to raise customer awareness while providing support from issuing institutions, aiming toward safe, efficient, and risk-minimized card usage.
First: Enhancing risk awareness in credit card usage
Cardholders need to clearly recognize potential risks when using credit cards, including security risks, financial risks, social risks, and operational risks. Full awareness helps customers adopt appropriate usage behaviors, minimize unwanted risks, and optimize card efficiency.
Second: Raising awareness of costs and social impacts
Cardholders should carefully examine costs related to credit cards, such as cash advance fees, late payment fees, and over-limit fees, to weigh expenses against actual benefits. At the same time, they should avoid following social trends blindly, use credit cards only when necessary, and understand banking policies in order to distinguish between proper and improper behaviors, thereby reducing negative impacts.
Third: Improving knowledge of credit card policies
Understanding credit card policies enables cardholders to maximize card benefits while minimizing potential risks. Customers should carefully study card policies before making usage decisions.
Fourth: Increasing awareness of credit card utilities
Cardholders should be well informed about the utilities of credit cards, including expense management, quick payment capability, and usage-related promotions. A clear understanding of these utilities allows customers to take full advantage of the benefits and use credit cards more effectively.
Fifth: Reducing social and psychological risks from issuing institutions
Credit institutions should strengthen communication, PR, and customer guidance to improve product understanding. They should also promote a positive image of cardholders as smart financial managers, countering the negative perception that cardholders are financially distressed or indebted.
Sixth: Mitigating operational and financial risks from issuing institutions
Issuers should set appropriate credit limits for each customer, provide regular updates to help them control expenses, reduce fees and interest rates, ensure continuous system operation, and prepare backup facilities to promptly handle incidents and minimize losses.
Seventh: Minimizing security risks and protecting privacy
Issuers should upgrade security technology, replace magnetic stripe cards with chip cards, guide customers on card information protection, and issue fraud transaction alerts. Additionally, compensation mechanisms should be developed in cases of personal data breaches.
Eighth: Strengthening risk management structures in the credit card system
Credit institutions should research and establish operational and payment security regulations and procedures, update information from international card organizations, monitor and handle suspected fraudulent transactions promptly, and coordinate with legal authorities to limit risks and losses for card issuers.
Conclusion
In recent years, credit card services at banks, particularly in Hanoi, have experienced significant growth, becoming a convenient payment tool that saves time for customers in daily activities such as shopping and cash withdrawal. Based on behavioral theories such as TRA, TPB, and UTAUT, this study developed a theoretical framework and measurement scales for factors influencing customers’ proper use of credit cards.
The quantitative findings from 172 valid survey responses reveal four main factors affecting this behavior: Risk Perception, Cost and Social Trends, Bank Policy, and Utility. Correlation and regression analyses confirm the linear relationship between these four independent variables and the proper use of credit cards, with no evidence of multicollinearity. The descending order of influence is as follows: Risk Perception (β = 0.305), Cost and Social Trends (β = 0.267), Bank Policy (β = 0.241), and Utility (β = 0.173).
These results provide a scientific foundation for banks and related stakeholders to develop solutions that enhance awareness and guide customers toward the proper use of credit cards, thereby promoting safe, effective, and sustainable usage.
References:
- Ajzen, I, (1991), The theory of planned behavior, Organizational Behavior and Human Decision Processes, 50(2), 179–211.
- Ajzen, I, & Fishbein, M, (1975), Belief, attitude, intention and behavior: An introduction to theory and research, Reading, MA: Addison-Wesley.
- Bauer, R. A, (1960), Consumer behavior as risk taking, In R. S. Hancock (Ed,), Dynamic marketing for a changing world (pp, 389–398), Chicago: American Marketing Association.
- Cunningham, S. M. (1967). Perceived risk and brand loyalty. Journal of Marketing Research, 4(4), 455–459. https://doi.org/10.1177/00222437670040040
- Davis, F. D, (1989), Perceived usefulness, perceived ease of use, and user acceptance of information technology, MIS Quarterly, 13(3), 319–340.
- Featherman, M. S., & Pavlou, P. A. (2003). Predicting e-services adoption: A perceived risk facets perspective. International Journal of Human-Computer Studies, 59(4), 451–474. https://doi.org/10.1016/S1071–5819(03)00111–3
- Johnson, T, & Attman, J, (1992), Compulsive buying behavior, Journal of Consumer Research, 19(3), 394–395.
- Mibrand, (2021), Banking Product U&A Report — Research on behaviors and habits of using banking products, Hanoi: Mibrand Research & Consulting.
- Meidan, A, & Davos, E, (1994), Credit card markets in Europe: A comparative study, Journal of Financial Services Marketing, 1(1), 45–60.
- Mehrabian, A, & Russell, J. A, (1974), An approach to environmental psychology, Cambridge, MA: MIT Press.
- Nunnally, J. C, & Bernstein, I. H, (1994), Psychometric theory (3rd ed,), New York: McGraw-Hill.
- Trinh, T. P. T, Tran, Q. T, & Vuong, B. N, (2020), Perceived risk assessment of customers on the intention to use bank credit cards in Vietnam, Management Science Letters, 10(14), 3361–3370.
- Wei, N, Liu, L, Wang, S, & Dong, D, (2017), Modeling the trend of credit card usage behavior for different age groups based on singular spectrum analysis, Sustainability, 9(10), 1844.
- Venkatesh, V, Morris, M. G, Davis, G. B, & Davis, F. D, (2003), User acceptance of information technology: Toward a unified view, MIS Quarterly, 27(3), 425–478.
- Venkatesh, V, & Davis, F. D, (2000), A theoretical extension of the Technology Acceptance Model: Four longitudinal field studies, Management Science, 46(2), 186–204.
- Venkatesh, V, & Bala, H, (2008), Technology acceptance model 3 and a research agenda on interventions, Decision Sciences, 39(2), 273–315.
- Vietnam State Bank (2024), Circular No. 18/2024/TT-NHNN dated 28 June 2024, Regulations on Bank Card Operations, Hanoi.

