1. Introduction
Hydropower remains one of the most established renewable energy technologies in the world energy system. According to IRENA, global hydropower capacity exceeded 900 GW by the beginning of the 2010s, while hydropower contributed roughly one sixth of global electricity generation [2, p. 12]. In mountainous countries, where rivers combine steep gradients with relatively high runoff, the assessment of local small hydropower resources is still important for both regional planning and engineering education.
The concept of “small hydropower” is not fully uniform across the literature. ESHA and many recent academic studies use an upper threshold of 10 MW [1, p. 10; 3]. In some national systems, however, higher thresholds are also found. This contradiction matters methodologically, because the same river may be discussed as a micro-, mini- or small-hydropower resource depending on the adopted classification. In this paper, the narrower and more common threshold of up to 10 MW per plant is accepted.
For Kyrgyzstan, such assessments are relevant because the country is mountainous and hydropower-oriented, yet many local streams and tributaries remain poorly represented in published reach-based inventories. The Alamedin River is of particular interest because it belongs to the northern slope of the Kyrgyz Ala-Too, is linked to the Bishkek area, and demonstrates a combination of steep upper reaches and increasing discharge downstream. In the author’s research practice, the river was also used as a case study for constructing a water-energy cadastre and checking its calculation logic against institutional materials.
The purpose of the article is to estimate the gross theoretical hydropower potential of the Alamedin River on the basis of the author’s cadastre calculations, to identify the reaches with the highest energy concentration, and to compare the result with approaches used in similar studies. The paper does not attempt to calculate installed capacity, annual generation, cost indicators or ecological constraints. If such data are not available, this is stated directly.
2. Review of Relevant Studies
The literature used in the present article can be divided into two groups: methodological sources that explain the formulas and categories of hydropower potential, and case studies that demonstrate how the approach is implemented in practice.
A key methodological source is the ESHA guide on small hydropower development. It explains the standard dependence of hydraulic power on discharge and gross head and presents the practical engineering formulation P = QHγ, where γ is the specific weight of water [1, p. 44]. IRENA, in turn, distinguishes gross theoretical, technically exploitable and economically exploitable hydropower potential and explicitly notes that these categories should not be mixed [2, p. 12–14]. This distinction is essential for the Alamedin River case, because the available spreadsheet makes it possible to estimate theoretical values, but does not contain the full set of technical and economic parameters needed for deeper screening.
Among similar articles, Jung et al. (2021) are especially relevant. Working with three small hydropower plants in South Korea, they assessed potential in ungauged basins and discussed both theoretical and technical potential. Their selected plants had capacities from 2.214 to 2.6 MW [3]. The article is important not because the Korean values can be copied to Kyrgyzstan, but because it demonstrates a clean structure for small hydropower assessment: problem statement, method, reach or site characteristics, results, and discussion of uncertainty.
Korkovelos et al. (2018) provided a much broader GIS-based assessment for Sub-Saharan Africa. Their study covered 44 countries, analysed 712,615 km of perennial rivers, used 1,393 gauging stations for validation, and identified 15,599 potential sites with a combined technical potential of 25,221 MW [4]. The scale is entirely different, yet the article shows how spatial hydropower screening benefits from consistent reach segmentation and transparent assumptions. Another recent example is the work of Punys et al. (2023) for Uganda, where multisource geospatial data were used to identify around 500 high-energy reaches or development points, with explicit screening against protected areas and distance to the grid [5].
A more focused single-site example is provided by Bezabih (2021), who evaluated a small hydropower opportunity at the Ribb irrigation dam in Ethiopia. That study reported an average flow of 14.6331 m³/s, a net head of 70.37 m, and an average nominal power of 5.53 MW [6]. The result is again not directly comparable to Alamedin, but it illustrates an important point: once flow duration curves, head losses and machine parameters are introduced, the research moves from theoretical resource estimation to engineering feasibility. The present paper remains at the earlier stage.
3. Materials and Methods
The empirical basis of the paper is the author’s water-energy cadastre of the Alamedin River compiled in spreadsheet form during master’s research work [7]. The cadastre contains 22 calculation reaches and records the following variables: elevation, cumulative distance from the source, tributary catchment area, cumulative catchment area, mean discharge in the reach, channel slope, specific power, and gross reach power. The terminal values in the spreadsheet indicate a cumulative basin area of 354.97 km² and a mean annual discharge of 6.36 m³/s at the downstream end of the analysed river profile [7].
For publication purposes, the column labels of the spreadsheet require harmonisation. The raw file labels the two final indicators as “specific power, kW/km” and “power, kW”. However, the applied formulas and the numerical values show that the physically consistent interpretation is MW/km for the specific indicator and MW for reach power. In other words, the publication version corrects the unit presentation while preserving the original numerical values. This is one of the main technical corrections introduced after reviewing the draft article.
The principal formula is the standard theoretical hydropower equation: P_th = ρgQH, where ρ is water density, g is gravitational acceleration, Q is discharge, and H is gross head [1, p. 44; 3]. In practical units, reach power in megawatts can be written as P_th = 9.81QH/1000, where Q is in m³/s and H is in metres. For a river profile represented by a slope I and a reach length ΔL, H = I·ΔL. Therefore, the specific hydropower potential per kilometre of river can be written as N_sp = 9.81QI, expressed in MW/km, and gross theoretical reach power as P_r = N_sp·ΔL_km.
The study area is illustrated by the basin-boundary map prepared by the author in GIS (Figure 1). The figure is not an external literature source but an authorial research product used to spatially delimit the catchment. The analytical procedure consisted of four steps: (1) checking the spreadsheet structure and excluding summary rows from the calculation array; (2) recalculating descriptive statistics for all reaches; (3) ranking reaches by gross theoretical power; and (4) comparing the resulting pattern with the logic reported in published small hydropower studies. No turbine efficiency was applied, because the available data are insufficient for a reliable technical-potential assessment.
It is important to state the limitations explicitly. The spreadsheet contains mean discharge values, but does not contain a flow duration curve, seasonal hydrographs, environmental flow requirements, head losses, conveyance options, turbine selection, costs, or grid-connection parameters. Consequently, the present paper estimates only gross theoretical potential. Any statement about technical feasibility, annual generation, payback period, NPV or LCOE would go beyond the available evidence.
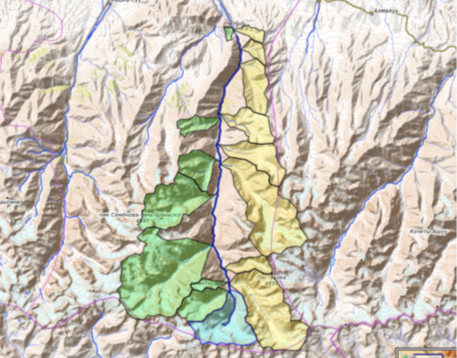
Fig. 1. Boundaries of the Alamedin River basin (source: author’s GIS material)
4. Results
The analysed cadastre includes 22 reaches. The cumulative profile length is 37.635 km, the terminal cumulative catchment area is 354.97 km², and the mean annual discharge at the lower end of the profile is 6.36 m³/s [7]. After harmonising the units, the total gross theoretical hydropower potential of the analysed reaches equals 53.81 MW. The mean reach power is 2.45 MW, and the mean specific power is 0.132 MW/km. The maximum gross reach power is 8.85 MW, while the maximum specific power is 0.718 MW/km.
The spatial distribution of the resource is uneven. The five most powerful reaches account for 53.4 % of the total potential, and the ten leading reaches account for 81.2 %. This concentration is one of the central findings of the article. It means that, even at the theoretical stage, a limited number of reaches control most of the hydropower value of the river.
Two different patterns can be observed. In the upper part of the river, steep gradient produces very high specific power even under relatively low discharge. This is why the reach at 7.448 km has the highest specific power, 0.718 MW/km, although its discharge is only 0.534 m³/s. Downstream, the river benefits from larger discharge, and this raises gross reach power even where the slope is more moderate. As a result, one of the most powerful reaches appears at 31.353 km, where discharge reaches 4.509 m³/s and gross theoretical power rises to 8.846 MW.
Table 1
The eight reaches with the highest gross theoretical hydropower potential
|
Rank |
Reach no. |
Chainage, km |
Q, m³/s |
Slope, m/m |
Specific power, MW/km |
Gross power, MW |
|
1 |
17 |
31.353 |
4.509 |
0.00638 |
0.282 |
8.846 |
|
2 |
22 |
37.635 |
6.360 |
0.00239 |
0.149 |
5.615 |
|
3 |
2 |
7.448 |
0.534 |
0.13695 |
0.718 |
5.348 |
|
4 |
11 |
20.785 |
3.571 |
0.00722 |
0.253 |
5.255 |
|
5 |
15 |
25.513 |
4.142 |
0.00353 |
0.143 |
3.657 |
|
6 |
10 |
17.823 |
2.912 |
0.00673 |
0.192 |
3.428 |
|
7 |
18 |
32.858 |
4.561 |
0.00213 |
0.095 |
3.132 |
|
8 |
7 |
12.490 |
2.275 |
0.01041 |
0.232 |
2.901 |
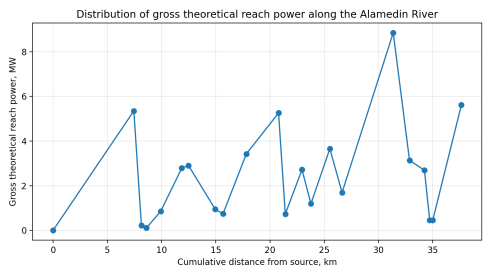
Fig. 2. Distribution of gross theoretical reach power along the Alamedin River
Table 1 confirms the concentration effect numerically. The most powerful reach is reach 17 (31.353 km from the source), with 8.846 MW, followed by reach 22 (37.635 km), with 5.615 MW, and reach 2 (7.448 km), with 5.348 MW. The fourth and fifth positions are occupied by reaches 11 and 15, with 5.255 and 3.657 MW respectively. These values are high enough to justify detailed follow-up screening, but not high enough to justify immediate engineering conclusions without additional hydrological and topographic data.
A final result worth stressing is the difference between the mean specific indicator and the mean reach indicator. The average specific power of 0.132 MW/km characterises the energy density of the river profile. The average reach power of 2.45 MW reflects both energy density and actual reach length. For publication purposes, this distinction is more informative than reporting only a single aggregate number.
5. Discussion
The obtained result should be interpreted as a theoretical upper estimate rather than as a ready project portfolio. This distinction is supported by the literature. IRENA explicitly separates theoretical, technical and economic potential [2, p. 12–14]. Jung et al. (2021) moved beyond theoretical estimation because they had site-specific information for existing or planned facilities [3]. Punys et al. (2023) added spatial constraints such as protected areas and proximity to the electricity grid [5]. In the Alamedin case, those additional filters are currently absent, so any direct conversion of 53.81 MW into feasible installed capacity would be methodologically incorrect.
Still, the result is useful. First, it identifies where future work should be concentrated. Second, it shows that different parts of the river perform differently: steep upper reaches dominate the specific indicator, while lower reaches with larger discharge contribute strongly to total gross power. Third, it helps distinguish between two research tasks that are often confused in student work: the mapping of a river’s energy resource and the preparation of a hydropower feasibility study. The first task has been completed here; the second requires more data.
A comparison with similar studies reinforces this point. The Korean cases analysed by Jung et al. (2021) involved plants with capacities between 2.214 and 2.6 MW [3]. In the Ethiopian case analysed by Bezabih (2021), the average nominal power reached 5.53 MW [6]. By contrast, the Alamedin River assessment yields a chain of theoretical reach values, not final plant capacities. Some individual reaches lie in a comparable magnitude range, yet this does not mean that equivalent projects can be built there. The available evidence is insufficient for that claim.
The article also reveals an educationally important issue: spreadsheet hydropower cadastres require critical review before publication. In the initial working file, the last two columns were labelled in kW/km and kW, while the formulas and values corresponded to MW/km and MW. Such inconsistencies are common in student-generated engineering tables. Correcting them is not a minor editorial change but a substantive scientific requirement. The practical lesson is clear: every table heading and unit must be checked against the embedded formula, not only against habit.
Finally, the study reflects a real educational practice in applied water and energy research. The cadastre was produced as part of master’s work and cross-checked during research training related to hydropower analysis. This kind of university–practice linkage is valuable because it trains students to move from Excel computation to scientific interpretation. At the same time, the publication format forces an additional discipline: clear terminology, explicit limits of inference, and comparison with the literature rather than reliance on raw calculations alone.
6. Conclusion
The article presented a reach-based assessment of the gross theoretical small hydropower potential of the Alamedin River using the author’s water-energy cadastre and GIS materials. After harmonising the spreadsheet units and analysing 22 reaches, the total gross theoretical potential was estimated at 53.81 MW. The resource is unevenly distributed: five reaches account for 53.4 % of the total potential, and ten reaches account for 81.2 %.
The main methodological conclusion is that the Alamedin River spreadsheet can support a scientifically defensible estimate of theoretical potential, but not a full technical or economic feasibility study. Data are insufficient for head-loss calculations, seasonal reliability assessment, turbine selection, environmental-flow analysis, and financial evaluation. Therefore, the present result should be treated as a first-stage screening output.
For a first student article, this scope is adequate and academically honest. The next logical step is not to inflate the result, but to narrow further work to the strongest reaches and supplement the cadastre with hydrological verification, topographic profiling, environmental constraints and cost data. Only after that would estimates of technical potential, annual generation and economic performance become methodologically justified.
References:
- European Small Hydropower Association. Guide on How to Develop a Small Hydropower Plant. Brussels: ESHA, 2004.
- International Renewable Energy Agency. Renewable Energy Technologies: Cost Analysis Series. Hydropower. Abu Dhabi: IRENA, 2012.
- Jung S., Bae Y., Kim J., Joo H., Kim H. S., Jung J. Analysis of Small Hydropower Generation Potential: (1) Estimation of the Potential in Ungaged Basins // Energies. 2021. Vol. 14. No. 11. Article 2977.
- Korkovelos A., Mentis D., Siyal S. H., et al. A Geospatial Assessment of Small-Scale Hydropower Potential in Sub-Saharan Africa // Energies. 2018. Vol. 11. No. 11. Article 3100.
- Punys P., Dumbrauskas A., Kvaraciejus A., Vyciene G. Small Hydropower Assessment of Uganda Based on Multisource Geospatial Data // Water. 2023. Vol. 15. No. 11. Article 2051.
- Bezabih B. Evaluation of Small Hydropower Plant at Ribb Irrigation Dam in Amhara Regional State, Ethiopia // Journal of the Ethiopian Institution of Water Resources. 2021. Vol. 1. Article 5.
- Kiizbaev B. Water-Energy Cadastre of the Alamedin River: author’s spreadsheet calculations. Unpublished dataset, 2026.

