1. Introduction
There is broad consensus that the climate is changing, and the amount of supporting evidence has become increasingly substantial [1]. For example, during the 20th century, the strongest warming trend of the millennium was observed, with the average air temperature increasing by approximately 0.6°C [2]. The most significant factor contributing to global warming is considered to be the impact of human activities on the environment [3]. In the future, the global mean air temperature is expected to continue rising, with projections estimating an increase of 1.0–3.5 °C by the year 2100 [4, 5]. This temperature change is spatially heterogeneous [6, 7].
Mongolia is a landlocked country with a continental and extreme climate, uneven spatial distribution of water resources, and high vulnerability to climate change [8–10]. At the national level, between 1940 and 2022, the average air temperature increased by approximately 2.2–2.4 °C, which is about twice the global average. Although the annual total precipitation has remained relatively stable, the seasonal variability and spatial distribution patterns have changed significantly [11–13]. This has become a key factor negatively affecting the seasonal distribution and recharge capacity of surface and groundwater resources [14, 15].
About 65–70 % of Mongolia’s surface water resources are located in the Arctic Ocean basin, particularly within the Selenge–Orkhon river system, which also hosts the country’s main population centers, industrial production areas, and urbanized regions [16, 17]. Therefore, changes in the water resources of the Selenge–Orkhon river system have strategic significance, directly affecting not only the natural ecosystem but also the sustainable socio-economic development of the country [18–20].
The Orkhon River is the largest tributary of the Selenge River and constitutes the main hydrological axis of central Mongolia, making it a strategically important watershed [19, 21]. The total area of this watershed is approximately 53,784.1 km², covering about 8 % of Mongolia’s total territory [16, 22]. Within the watershed, 25–30 % of the country’s total population and about 40 % of industrial output are concentrated, clearly demonstrating that the water resources of the Orkhon River are an integral and irreplaceable component of both natural and socio-economic systems.In recent decades, activities across multiple sectors—such as mining, processing industries, urbanization, irrigated agriculture, livestock husbandry, and tourism—have developed rapidly in the Orkhon River watershed. This has led to a sharp increase in water consumption, accompanied by a noticeable rise in anthropogenic pressure on water quality [23]. In particular, previous studies have noted that mining activities, the expansion of urban settlements, and the growth of irrigated agriculture directly and indirectly affect the seasonal distribution of river discharge, water balance, and water quality [24, 25].
The Orkhon River watershed is a sub-basin of the Selenge River and, ultimately, part of the Lake Baikal catchment system. However, the primary focus of this study is not on Lake Baikal’s water level, but on the internal water resources, hydrological regime, climate change, and the interactions with human activities within the Orkhon River watershed. Therefore, it is essential to study the watershed’s water resources, climate, hydrological regime, changes in water availability, and their interrelated dynamics as an integrated system.
2. Materials and Methods
2.1. Study Area
The Orkhon River watershed, the study area, is one of Mongolia’s most important regions in terms of environment and socio-economic development. Administratively, it spans 53 soums across 8 provinces, as shown in Figure 1 . The majority of the watershed area is occupied by Arkhangai (38.2 %), Bulgan (22.1 %), Selenge (18.4 %), and Uvurkhangai (15.9 %) provinces, while the remaining portions are distributed across Tuv (1.9 %), Bayankhongor (1.6 %), Orkhon (1.6 %), and Darkhan-Uul (0.4 %) provinces [26]. Considering administrative coverage, only 0.05 km² of Undur-Ulaan soum in Arkhangai province falls within the watershed, whereas the entire territories of Bulgan, Ulziit, Tuwshruulekh, and Khotont soums in Arkhangai, Bayan-Undur soum in Orkhon, and Khujirt soum in Uvurkhangai are fully included [27].
The Orkhon River is the largest tributary of the Selenge River, and its length varies depending on the cartographic materials used by researchers. When calculated using a 1:100,000 scale map within a geographic information system (GIS), the river’s length is 1,066 km, whereas using the 1:1,000,000 hydrological network map developed by the Institute of Geography and Geoecology of the Mongolian Academy of Sciences indicates a length of 919 km [27]. Previous studies have reported the river’s length as 922 km, while some publications cite it as 1,100 km [28].
The highest point in the Orkhon River watershed is the peak of Angarkhai Mountain, rising to 3,539.9 m, while the lowest point is located at the confluence where the Orkhon River flows into the Selenge River at 601.1 m above sea level [28, 29]. The source of the Orkhon River is considered to be the Ikh Teel River, originating from the southern slopes of Suvarga Khairkhan Mountain in the Khangai Range (3,117 m above sea level), at the confluence with the Ult River.
This region constitutes the core area of the Orkhon Valley Cultural Landscape, a UNESCO World Heritage site, and is of exceptional hydrological, ecological and historical significance [30, 31]. In its upper reaches, the river flows through mountainous terrain; as it descends, it passes through moderately hilly landscapes; further downstream, it traverses plains, steppes, and mountain valleys [32]. The river forms deep rocky gorges in its valleys and broadens into multiple channels in its lower reaches. The geographic coordinates of the Orkhon River’s source are 101°20′13″ E, 47°03′07″ N, and its mouth is located at 106°08′55″ E, 50°14′42″ N. The outer boundaries of the watershed are defined as follows: West: 100°20′25″ E, East: 106°37′31″ E, North: 50°21′15″ N, South: 46°26′05″ N [30, 33].
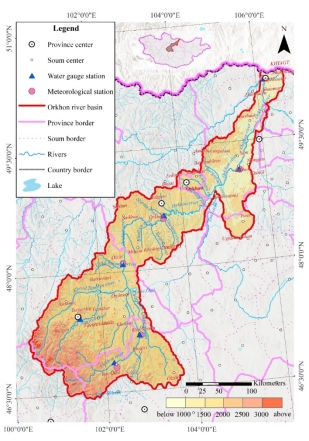
Fig. 1. Location of the Orkhon River Basin
2.2. Data Sources
Air temperature and precipitation data for the Selenge River basin in Mongolia were obtained from the online database of the Institute of Meteorology, Hydrology and Environmental Research (IMHER) at https://irimhe.namem.gov.mn/en.
To calculate changes in lake surface area between 1990 and 2020 at five-year intervals, satellite imagery from Landsat Thematic Mapper (TM) and Landsat Enhanced Thematic Mapper Plus (ETM+) with a spatial resolution of 30 m was used (http://landsat.usgs.gov/).
2.3. Methodology
Long-term air temperature and precipitation data from multiple representative stations within the Orkhon River watershed were used in this study. The data covers the period 1990–2025 and was processed into annual and seasonal aggregates suitable for detecting long-term trends. The selected stations represent the main sub-regions of the watershed, allowing consideration of spatial variations such as elevation, latitude, and catchment characteristics.
The following general steps were implemented during data processing:
– Checking for missing values, errors, and extreme outliers in the observation series.
– Calculating annual totals and averages using consistent standard.
– Aggregating data from individual stations to ensure comparability across identical time periods.
– Preparing the time series in a formats suitable for statistical analyses, such as trend detection.
2.3.1. Mann–Kendall (MK) trend test
Long-term trends (increasing or decreasing) were determined using the Mann–Kendall (MK) test. The MK test results are expressed as a Z-statistic, where Z > 0 indicates an increasing trend and Z < 0 indicates a decreasing trend. The significance of the trend was evaluated at the 0.1, 0.05, and 0.01 levels. This non-parametric approach enables the identification of statistically significant monotonic trends in hydroclimatic variables without requiring the data to follow a normal distribution. The statistical significance of the test depends on the length of the dataset, the sample size, and the variability within the series. Since the MK test is based on the number of positive and negative differences, it is an effective method for detecting significant changes in a data series over time [34–36].
The river discharge was compared with long-term climatic statistics to determine trends in flow changes. The Mann–Kendall (MK) test uses all data values to calculate the correlation, and the MK statistic (S) is computed as follows:
Here, the data values


Here,


The variance of the time series, Var(S), is calculated as follows [37]:

Here,


Here, when


To calculate changes in river discharge, variations in water flow are expressed and analyzed independently along the time series [40, 41]:

Here, the


2.3.2. Innovative Trend Analysis Method (ITAM)
The MK test is effective for detecting the presence of a trend, but it has limited ability to identify the specific nature of the change, such as abrupt shipts, stepwise variations, or asymmetric behavior. Therefore, to reinforce the MK test results and more sensitively capture the characteristics of changes, the Φ statistic from the ITAM method was calculated. Φ reflects both the strength and direction of the trend and was used to compare spatial differences between stations.
The Innovative Trend Analysis Method (ITAM) compares two halves of a time series and evaluates directional tendencies in hydrogical and climatic variables [43, 44]. The indicator is defined as follows:
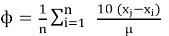
Here,


2.3.3. Sen’s slope estimator (β)
In addition to identifying the presence or absence of a trend, Sen’s slope (β) was applied to quantify the magnitude of change (annual increase or decrease). This method calculates the slopes of all possible data pairs within the time series and represents the overall trend using the median slope. As it does not require a normal distribution and is robust against data variability and outliers, it provides a reliable estimate of trend magnitude. Accordingly, changes in temperature (°C/year) and precipitation (mm/year) were expressed in quantitatively.
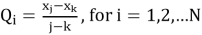
River discharge magnitude was determined using the slope estimation method, whereby the rate of change in flow over time was calculated [35, 45]. The slope between two data points,

Here:
Here,


where
where


2.3.4. Normalized Difference Water Index (NDWI) Method
This method is widely used to calculate changes in lake morphology and surface water area. The NDWI is computed using the Green band (G) and the Near-Infrared band (NIR) as follows [46].

NDWI values range from −1 to +1. Positive values indicate the presence of water bodies, whereas negative values represent dry surfaces, built-up areas, and other non-water features [47].
2.3.5. Water balance method
The differential equation for the water balance of any lake can be expressed as follows [48, 49].
Here,


2.3.6. Change in Lake Volume
Here,


Linear Regression:
This method is used to determine temporal trends by comparing climatic variables with river discharge, allowing the identification of patterns and relationships over time [35, 50]. The regression parameters are


|
|
(12) |
Here,
and when


Correlation Coefficient: The impact of hydroclimatic factors on land cover changes in the Selenge River basin was assessed using the correlation coefficient method. The correlation coefficient was calculated using the following equation. Here:
Here,


3. Results
3.1. Changes in Water and Climate
3.1.1 Air Temperature
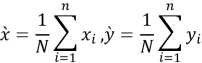
Changes in precipitation and air temperature in the Orkhon River watershed were analyzed over a 35-year period using the Mann–Kendall (MK) test. The results show that Z-values at most stations are positive, indicating an increasing trend in air temperature. In particular, Kharkhorin station in Uvurkhangai province (Z = 2.04) and Orkhon station in Bulgan province (Z = 1.37) exhibit statistically significant temperature increases (Figure 2).
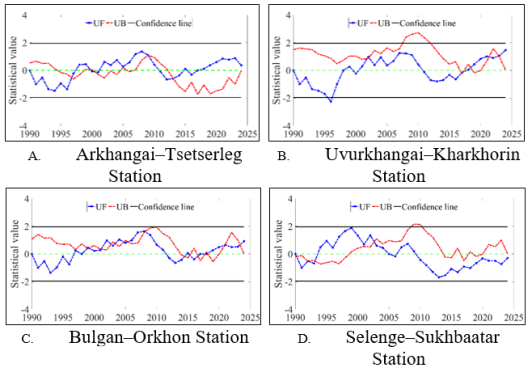
Fig. 2. Trends of annual temperature across stations in the Orkhon base (note: UF and UB are changing parameters where UB= -UF)
The average Z-value of 1.64 indicates a weak but positive warming trend at the regional scale, while the mean Φ-value of −1.25 suggests that the temperature trend is spatially heterogeneous and varies across the watershed (Table 1).
Table 1
The result of Z-statistic of MK, ITAM (ф), and Sen’s slope estimator test (β)
|
S/No. |
Name of Stations |
Z |
ф |
β |
|
Air temperature | ||||
|
1 |
Bulgan aimag Orkhon sum |
1.37* |
-1.33* |
0.01 |
|
2 |
Uvurkhangai aimag Kharkhorin sum |
2.04** |
0.14 |
0.02 |
|
3 |
Arkhangai aimag urd tamir |
0.59 |
2.94** |
0.00 |
|
4 |
Selenge aimag |
-0.34 |
-2.14** |
0.00 |
|
5 |
Average |
1.64* |
-1.25* |
0.01 |
|
* Trends at 0.1 significance level; ** Trends at 0.05 significance level; *** Trends at 0.01 significance level. | ||||
3.1.2. Precipitation
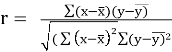
The Orkhon River watershed has a relatively humid climate, with annual precipitation ranging from approximately 200 to 400 mm. In the high mountainous areas, where major rivers originate, annual precipitation exceeds 350 mm, with about 85–90 % of the total occuring during the warm season. Between 1995 and 2005, the watershed experienced a consistent decrease in precipitation (UB < 0). From 2005 to 2025, UB > −2, indicating a steady increase in precipitation. Notably, between 2020 and 2025, UB > 2, reflecting a sharp rise in precipitation, whereas during the period 2000–2005, UB < −2, marking the lowest precipitation levels observed (Figure 3).
Fig. 3. Trends of annual precipitation for across stations in the Orkhon base (note: UF and UB are changing parameters where UB= -UF)
Table 2 presents the long-term precipitation trends at the studied stations based on the Mann–Kendall (MK) test Z-statistics, the Φ indicator derived from the Innovative Trend Analysis Method, and Sen’s slope (β). At all stations, the MK test Z-values are positive, ranging from 2.81 to 4.24, indicating an increasing precipitation trend. On average, Z = 4.24, Φ = 2.52, and β = 3.34, indicating a statistically significant and regionally coherent increase in annual precipitation across the watershed (Table 2).
Table 2
The result of Z-statistic of MK, ITAM (ф), and Sen’s slope estimator test (β)
|
S/No. |
Name of Stations |
Z |
ф |
β |
|
Precipitation | ||||
|
1 |
Bulgan aimag Orkhon sum |
3.84*** |
2.73** |
4.17*** |
|
2 |
Uvurkhangai aimag Kharkhorin sum |
3.01*** |
3.00*** |
3.16*** |
|
3 |
Arkhangai aimag urd tamir |
3.64*** |
1.86* |
3.18*** |
|
4 |
Selenge aimag |
3.76*** |
2.33** |
3.03*** |
|
5 |
Average |
4.24*** |
2.52** |
3.34*** |
|
* Trends at 0.1 significance level; ** Trends at 0.05 significance level; *** Trends at 0.01 significance level. | ||||
The Mann–Kendall analysis indicates that a negative precipitation trend dominated across the study area between 1990 and 2005, reflecting the intensification of aridification processes during this period. However, between 2008 and 2015, the UF and UB curves intersected at most soums, indicating a transition toward a positive precipitation trend. In particular, precipitation increases in Arkhangai (Tsetserleg) and Uvurkhangai (Kharkhorin) reached statistically significant levels, whereas increases observed in the Orkhon and Selenge regions were of moderate statistical significance.
3.1.3. River Discharge
Long-term average discharge data from four hydrological stations in the Orkhon River watershed over the past 35 years were analyzed using the Mann–Kendall (MK) method. At the Orkhon–Kharkhorin station in Uvurkhangai province, the annual mean discharge exhibits a statistically significant decreasing trend (Z = −2.0**), whereas other stations exhibit smaller declining trends (Z = −1.07 to −1.37). Overall, the MK test results indicate a basin-wide decline in river discharge, with the most pronounced reduction observed at the Orkhon–Kharkhorin station (Figure 4).
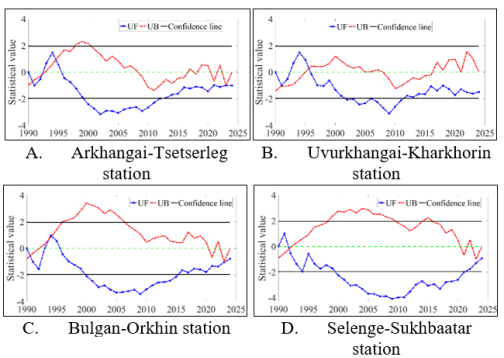
Fig. 4. Trends of river discharge for across stations in the Orkhon base (note: UF and UB are changing parameters where UB= -UF)
Table 3 presents the long-term river discharge trends at the studied stations based on Mann–Kendall (MK) Z-statistics, the Φ indicator derived from the Innovative Trend Analysis Method, and Sen’s slope (β). At all stations, MK test Z-values are positive, ranging from 2.81 to 4.24, indicating an increasing precipitation trend. On average, Z = 4.24, Φ = 2.52, and β = 3.34, showing a pronounced increase in precipitation across the study region (Table 3).
Table 3
The result of Z-statistic of MK, ITAM (ф), and Sen’s slope estimator test (β)
|
S/No. |
Name of Stations |
Z |
ф |
β |
|
River discharge | ||||
|
1 |
Bulgan aimag Orkhon sum |
-1.07* |
-3.39*** |
-0.23 |
|
2 |
Uvurkhangai aimag Kharkhorin sum |
-2.00** |
-1.77** |
-0.12 |
|
3 |
Arkhangai aimag urd tamir |
-1.25* |
-0.81 |
-0.72 |
|
4 |
Selenge aimag |
-1.37* |
-1.70* |
-0.06 |
|
5 |
Average |
-1.42* |
-1.92* |
-0.28 |
|
* Trends at 0.1 significance level; ** Trends at 0.05 significance level; *** Trends at 0.01 significance level. | ||||
The Mann–Kendall analysis indicates that river discharge declined considerably between 1990 and 2005 across all studied areas, with negative trends dominating and reflecting the intensification of aridification processes during this period. However, between 2008 and 2015, intersections of the UF and UB curves were observed at most soums, showing a shift toward a slightly increasing discharge trend.
3.2. Hydrological Changes in the Orkhon River Watershed
3.3.1. Average River Discharge
Monthly and annual average river discharge is a fundamental parameter for water use, management, and conservation planning. The flow norm of a river refers to the long-term average of discharge records covering several complete hydrological cycles. Extending the observation period improves the statistical reliability and representativeness of calculated average discharge values. Monthly and annual averages not only characterize the stable hydrological behavior of the watershed but also indicate the potential availability of water resources.
Rivers originating from the Khangai Mountains are strongly influenced by summer rainfall and spring snowmelt flood patterns. In the Orkhon River watershed, rivers typically become ice-free in spring, and following seasonal air temperature increases, the intensity of snomelt and water equivalent of accumulated snow determine the magnitude and duration of spring floods, which typically persist for 30–50 days.
The indicator representing the annual flow regime of rivers is the yearly hydrograph, which essentially reflects precipitation-driven discharge characterized by a rapidly fluctuating peak component and a relatively stable baseflow originating from groundwater. In other words, during the warm season, sufficient and intense rainfall—or, from a system response perspective, highly variable inflow—causes short-term rises and falls in water levels, producing the peak segments of the hydrograph. This is referred to as direct runoff or rainfall-induced runoff. Conversely, during dry intervals between precipitation events, river flow is primarily maintained by groundwater contributions, resulting in comparatively stable and low-variability discharge conditions.
Figure 5 illustrates the general patterns of annual hydrographs for rivers in the Orkhon River watershed, based on observed data, selecting years with average, high, and low flows. At the headwaters of the Orkhon watershed, the flow module reaches 2.93 L/(s·km²) and decreases to 0.01 L/(s·km²) at the mouth, with an average of 1.01 L/(s·km²) over the river’s total length. The multi-year average discharge at the Orkhon–Bat-Ulzii hydrological station is 9.97 m³/s, slightly increasing to 12.64 m³/s near Kharkhorin (Figure 5).
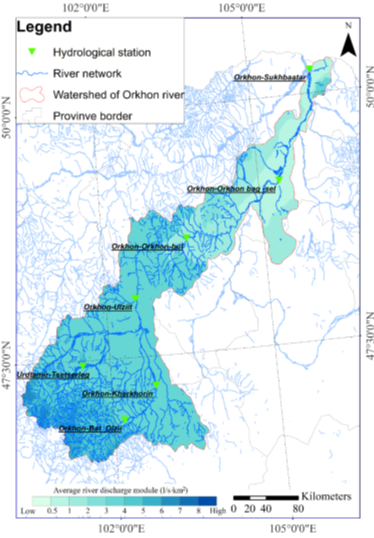
Fig. 5. Average river discharge of Orkhon river basin
Monthly and annual average river discharge is a fundamental parameter for any water use, management, or conservation planning. The flow norm of a river refers to the long-term average of discharge series covering several complete cycles. The longer the observation and study period, the more precise, reliable, and stable the average discharge becomes.
Monthly and annual averages not only provide a stable characteristic of the watershed’s flow but also indicate its potential water resources. Using long-term data from the Orkhon–Kharkhorin hydrological station, the annual average discharge series was extended to Orkhon–Bat-Ulzii, and statistical parameters of the Khoshgin Orkhon River’s average discharge were calculated up to 2024. These results are summarized in Table 4.
Table 4
Multi-Year Average Discharge
|
Hydrological River Observation Station |
Statistical parameters | ||
|
Multi-Year Average Discharge, m³/s |
Standard Deviation, Cs |
Coefficient of Variation, Cv | |
|
Orkhon — Kharkhorin |
11.92 |
0.95 |
0.52 |
|
Orkhon — Bat-Ulzii |
8.96 |
5.26 |
0.57 |
|
Urd Tamir — Tsetserleg |
8.49 |
0.49 |
0.89 |
|
Orkhon — Orkhon |
41.5 |
1.54 |
0.62 |
|
Orkhon — Sukhbaatar |
124.5 |
0.80 |
0.40 |
The long-term monthly and annual average discharges for the observed period are shown in the figure below. Based on both monthly and annual averages, the Orkhon River discharge is higher at Kharkhorin than at Bat-Ulzii (Figure 6) .
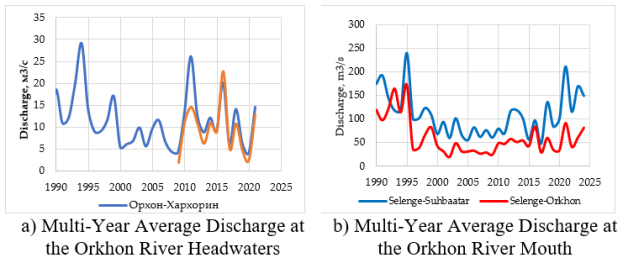
Fig. 6. Average annual flow of the Orkhon River
Monthly and annual average river discharge are fundamental parameters for water use, management, or conservation studies. The flow norm of a river refers to the long-term average of discharge records covering several complete cycles. The longer the observation and study period, the more precise, reliable, and stable the average discharge becomes. Monthly and annual average discharge not only provide a stable characteristic of a watershed’s flow but also indicate its potential water resources. In the Orkhon River, water resources increase progressively along the river course. The multi-year average discharge is 13.3 m³/s at Kharkhorin in Uvurkhangai province, approximately three times higher at Orkhon in Bulgan province, and about nine times higher at Sukhbaatar in Selenge province. This downstream increase reflects the cumulative expansion of the drainage area and the substantial contribution of major tributaries entering the main channel.
3.2.2. High River Discharge
In all rivers of the Orkhon River watershed, spring snowmelt floods, and occasional dry-season flood events are observed. Peak discharges during summer rainfall floods are consistently higher than those associated with spring snowmelt floods. Consequently, summer rainfall and late spring floods can pose significant risks to local populations and economic activities. Precipitation during the cold season (October–December) plays an important role in forming spring and early summer flows. Snow water reserves near the northern slopes of the Khangai Mountains amount to 20–30 mm. The runoff coefficient of spring snowmelt floods typically decreases to approximately 0.30 by late May to early June and increases again from mid-June (Figure 7).
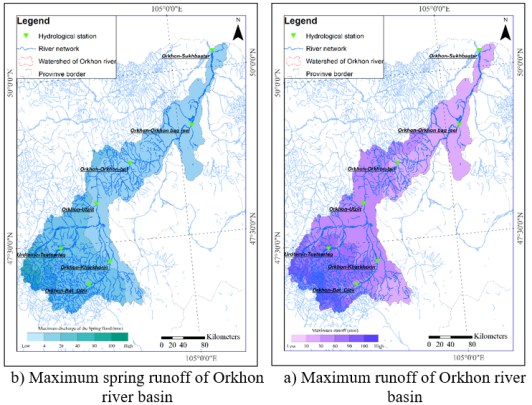
Fig. 7. Maximum runoff of Orkhon river basin
In Mongolia and within the Orkhon River watershed, intense rainfall floods are typically triggered by heavy precipitation events of 40–120 mm or more within a single day. Across all rivers in the Orkhon watershed, spring snowmelt floods, summer rainfall floods, and occasional dry-season flood events are observed. Peak discharges during summer rainfall floods are consistently higher than those associated with spring snowmelt floods. Consequently, summer rainfall and late spring floods create natural conditions that can cause significant damage to populations and economic activities. Spring snowmelt flows primarily originate from precipitation accumulated during the cold season (October–December).
Spring snowmelt floods in the Orkhon River generally occur in areas of the watershed with an average elevation above 2,500 m, typically during the first ten days of May. Using observational data from selected rivers and hydrological stations in the Orkhon watershed, peak discharges associated with both rainfall and snowmelt floods were estimated using mathematical and statistical methods, as summarized in Table 5 and Table 6. Maximum flood discharges were calculated for exceedance probabilities of 0.1 %, 2 %, 5 %, 10 %, and 25 %, corresponding to return periods of 1,000, 100, 50, 20, 10, and 4 years, respectively.
Table 5
Peak Discharge of Summer Rainfall Floods at Different Exceedance Probabilities
|
P, % |
1 |
2 |
5 |
10 |
25 |
|
T, Year |
100 |
50 |
20 |
10 |
4 |
|
Orkhon — Kharkhorin |
1006 |
800 |
513 |
369 |
198 |
|
Khoshgin Orkhon — Kharkhorin |
46.1 |
29.2 |
6.00 |
10.1 |
5.50 |
|
Urd Tamir — Tsetserleg |
49.3 |
43.3 |
35.3 |
29.1 |
22.5 |
|
Orkhon — Orkhon |
625.5 |
453.6 |
363.5 |
289.1 |
213.2 |
|
Orkhon — Sukhbaatar |
771.5 |
684.3 |
563.0 |
473.0 |
376.5 |
Table 6
Peak Discharge of Spring Snowmelt Floods at Different Exceedance Probabilities
|
River–Hydrological Station |
Definition of Discharge |
Exceedance Probability (%) | |||||
|
0.1 |
1 |
2 |
5 |
10 |
25 | ||
|
Orkhon — Kharkhorin |
Q, м 3 /с |
520 |
280 |
220 |
153 |
115 |
70 |
|
Urd Tamir — Tsetserleg |
Q, м 3 /с |
451.3 |
375.8 |
331.2 |
245.1 |
187.9 |
113.5 |
|
Orkhon — Orkhon |
Q, м 3 /с |
2215.1 |
1199.9 |
1024.2 |
709.2 |
540.0 |
346.8 |
|
Orkhon-Sukhbaatar |
Q, м 3 /с |
2370.1 |
1677.0 |
1514.8 |
1201.8 |
995.0 |
715.5 |
According to these calculations, flood discharges along the Orkhon River in the range of 500–1,700 m³/s are expected to occur roughly once every 100 years. Over the past nearly 20 years, the persistence of low-flow years has led to a decreasing trend in both snowmelt and rainfall peak floods, as clearly seen in Figures 6 and 7. This change has affected the magnitudes of extreme discharges at various exceedance probabilities, as estimated using long-term peak discharge series and probabilistic statistical models.
3.2.3. Low River Discharge
In Mongolia, rivers and streams remain frozen throughout the cold season, while during the warm season, precipitation occurs intermittently, resulting in extended periods of low or minimal flow between rainfall events. The Orkhon River experiences two low-flow periods annually: one in winter and one in summer. The minimum winter discharge at the Orkhon–Kharkhorin station is 0.069 m³/s, whereas the minimum summer discharge is 0.258 m³/s. Along the downstream course, minimum flows decrease further, and in some years, river sections near Orkhontuul in Selenge province freeze completely to the riverbed.
During low-flow periods, the discharge per unit area (flow module) of most rivers generally increases from the river mouth toward the middle reaches, mountain foothills, and headwaters, stabilizing around the central part of the watershed. In the northern frozen basin, the average flow module during the warm-season low-flow period ranges from 0.5 to 2.0 L/s·km². The warm-season minimum-flow period, following spring snowmelt and rainfall floods, lasts between 10 and 50 days for most rivers. In contrast, winter low-flow periods persist much longer, averaging 160–170 days in major rivers and 190–200 days in smaller streams. For rivers that do not freeze completely to the bed, the average winter low-flow module ranges from 0.20 to 0.40 L/s·km² (Table 7).
Table 7
Low-flow discharge with different exceedance probabilities
|
River–Hydrological Station |
Definition of Discharge |
Exceedance Probability (%) | |||||
|
50 |
75 |
80 |
90 |
95 |
97 | ||
|
Orkhon — Kharkhorin |
Warm |
1.82 |
0.94 |
0.83 |
0.61 |
0.32 |
0.30 |
|
Cold |
0.14 |
0.07 |
0.05 |
0.029 |
0.012 |
0.0 | |
|
Urd Tamir — Tsetserleg |
Warm |
2.43 |
1.58 |
1.46 |
1.01 |
0.73 |
0.62 |
|
Cold |
0.24 |
0.11 |
0.09 |
0.05 |
0.03 |
0.02 | |
|
Orkhon — Orkhon |
Warm |
0.83 |
0.59 |
0.53 |
0.38 |
0.30 |
0.26 |
|
Cold |
0.016 |
0.007 |
0.005 |
0.002 |
0.00 |
0.00 | |
3.2.4. Changes in Lakes of the Orkhon River Watershed
The Orkhon River watershed contains approximately 1,730 lakes, ponds, and reservoirs, of which over 100 have a surface area greater than 0.1 km² (based on the 1984 spatial map). The largest of these is Ugii Lake, accompanied by several smaller lakes such as Khukh Lake, Shireet Lake, Shorvog Lake, Doyt White Lake, Sangiin Dalai Lake, and Tsaidam Lake. Changes in lake water levels are influenced by climate, drought, and both internal and external geomorphic factors. Lakes are classified by origin into three main types: internal, external, and mixed. Internally formed lakes result from tectonic and volcanic activity; externally formed lakes are created by water erosion, rainfall, snowmelt, glaciers, wind processes, long-term permafrost dynamics, or valley subsidence; mixed-origin lakes develop under combined influences of snow, ice, and soil processes. Ugii Lake in the Orkhon watershed is an externally formed lake created by river channel migration and alluvial deposition (Figure 8 ) .
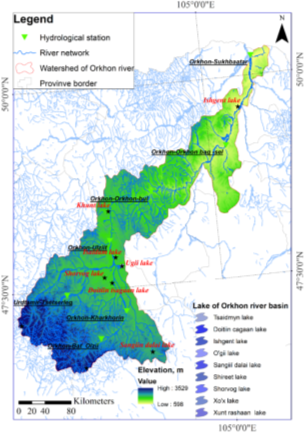
Fig. 8. Location of lakes in the Orkhon River basin
On topographic maps of the Orkhon River watershed, lakes with a surface area greater than 1.0 km² include Ugii Lake, Sangiin Dalai Lake, Shorvog Lake, Doyt White Lake, Tsaidam Lake, Khukh Lake, Shireet Lake, Khunt Spring Lake, and Ishgent Lakes, as listed in Table 8. The total water surface area of these lakes is 45.75 km².
Table 8
Definition of Lakes in the Orkhon River Watershed
|
Province |
soum |
Lake Name |
Longitude |
Latitude |
Elevation (m) |
M1:100000 Area (km²) |
|
Arkhangai |
Ugiinuur |
Shorvog nuur |
102.37 |
47.64 |
1337 |
2.37 |
|
Arkhangai |
Khotont |
Doitin Tsagaan nuur |
102.53 |
47.57 |
1363 |
2.17 |
|
Arkhangai |
Ulziit |
Tsaidmin nuur |
102.65 |
47.88 |
1315 |
1.37 |
|
Arkhangai |
Ugiinuur |
Ugii nuur |
102.78 |
47.77 |
1310 |
25.15 |
|
Uvurkhangai |
Ulziit |
Sangiin dalai nuur |
103.31 |
46.67 |
1709 |
2.18 |
|
Arkhangai |
Ikh Tamir |
Khukh nuur |
100.45 |
47.10 |
2665 |
6.73 |
|
Uvurkhangai |
Uyanga |
Shireet nuur |
101.82 |
46.53 |
2413 |
3.25 |
|
Bulgan |
Saikhan |
Khunt rashaant nuur |
102.56 |
48.46 |
1254 |
1.31 |
|
Selenge |
Khushaat |
Ishgent nuur |
105.76 |
49.62 |
654 |
1.23 |
According to satellite data, the total water surface area of all lakes was 45.75 km² in 1990. By 2000, it had decreased to 41.31 km², a 9.7 % reduction; in 2005, to 41.15 km² (10.1 %); in 2010, to 40.78 km² (10.9 %); in 2015, to 40.99 km² (10.4 %); and in 2020, to 42.58 km² (6.9 %). These changes are shown in Figure 9.
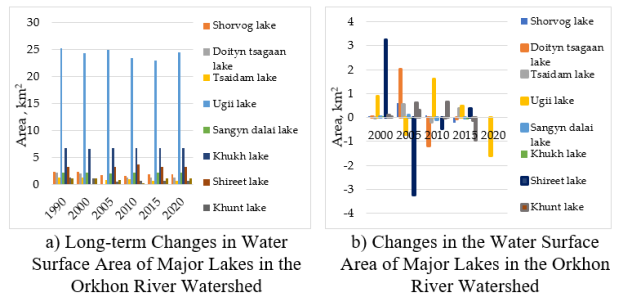
Fig. 9. Water Surface Area and Changes of Major Lakes in the Orkhon River Watershed
3.3. Relationship between Climate Change and River Discharge
The average annual air temperature in the Orkhon River watershed has increased by approximately 0.03 °C per year, totaling a rise of 0.78 °C over the past 34 years (Figure 10–c). The warmest year during the study period was 2007, while the coldest year was 2012. The long-term average annual precipitation in the watershed is 294 mm, however, recent years have experienced consecutive periods of below-average precipitation. Over the past 30 years, annual precipitation has shown an increasing trend of approximately 16 mm per year (Figure 10–d). Annual precipitation in the Orkhon River watershed is strongly positively correlated with river discharge (r = 0.76, p = 0.0001), whereas air temperature and other climatic variables show weak correlations with discharge (r < 0.12, p = 0.52). These results are illustrated in Figure 10.
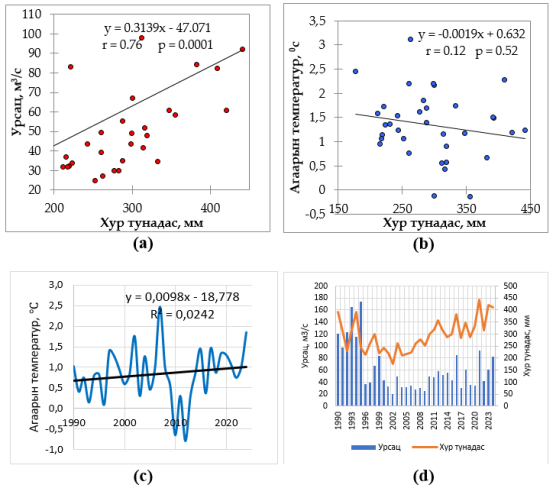
Fig. 10. Orkhon River Watershed: (a) air temperature and watershed mean precipitation, (b) watershed mean precipitation and river discharge, (c) air temperature, (d) correlation between discharge and precipitation
4. Discussion
The increase in air temperature reflects ongoing global climate change. Globally, the average air temperature increased by 0.85 °C between 1880 and 2018 and is projected to accelerate in the coming decades [51]. The annual average air temperature in the Orkhon River watershed showed an increasing trend of 0.78 °C over the historical period from 1990 to 2024, equivalent to approximately 0.09 °C per year. This rate is about 1.5 times higher than the global average warming rate of 0.006 °C per year. The climate of the Orkhon watershed in Mongolia is characterized by long, cold winters, dry and hot summers, low precipitation, and large temperature fluctuations [52]. Annual precipitation in the Orkhon River watershed ranges from 300–400 mm/year in the mountainous areas of Khangai, Khentii, and Khuvsgul, and from 150–250 mm/year in the steppe and river valley regions [53]. The findings of this study are consistent with previous research, which also indicates increasing air temperatures and precipitation patterns [52, 54]. The Orkhon River watershed is located in a continental to sharply continental climate zone, with a significant portion covered by permafrost [54]. The main water sources of water for the Orkhon River watershed are spring snowmelt, summer rainfall, and perennial snow. Approximately half of the annual discharge of the Orkhon River occurs during the summer months (June–August), while groundwater contributes minimally to total flow. Discharge varies mainly according to spring snowmelt and summer precipitation. In the Selenge River watershed, river flow is lowest during winter (November–March), accounting for only 3–10 % of the annual discharge. Spring snowmelt floods are relatively small, whereas summer and autumn rainfall events generate higher flood peaks [53]. Hydrological processes in the watershed are particularly sensitive. Trend analyses using Mann–Kendall (MK) test, the Innovative Trend Analysis Method (ITAM), and Sen’s slope estimator indicate a decreasing trend in river discharge at all monitored hydrological stations. Since 1995, river flows have shown a pronounced decline, which is likely influenced not only with climate variability but also mining expansion, industrial activities, agriculture, and urbanization within the watershed.
5. Conclusion
Air temperature in the Orkhon River watershed shows a statistically significant increasing trend (Z = 1.64), with an average annual rise of approximately 0.03 °C and a total increase of 0.78 °C over the 34 years. Precipitation also exhibits an increasing trend (Z = 4.22) with long-term average of 294 mm per year and a noticeable upward trend after 2005.
River water resources of the Orkhon River increase along its course. The multi-year average discharge is 13.3 m³/s at Kharkhorin in Uvurkhangai, approximately three times higher at Orkhon in Bulgan, and nearly nine times higher at Sükhbaatar in Selenge. This increase reflects the expansion of the catchment area and contributions from major tributaries.
Satellite data shows that the total lake surface area in the Orkhon River watershed was 45.75 km² in 1990. By 2000, it had decreased to 41.31 km², a 9.7 % reduction; in 2005, to 41.15 km² (10.1 %); in 2010, to 40.78 km² (10.9 %); in 2015, to 40.99 km² (10.4 %); and in 2020, to 42.58 km² (6.9 %). This decline corresponds with the 0.78 °C rise in air temperature over the past 34 years, suggesting that increased evaporation associated with warming has contributed to reduction in lake surface area.
Further studies are required to quantify watershed-scale evaporation and lake surface evaporation in the Orkhon River basin more precisely and to better identify the combined climatic and antropogenic factors influencing hydrological changes in the basin.
Funding: This research was funded by the National University of Mongolia under Grant Agreement P2025–5037.
References:
- Berrang-Ford, L., J. D. Ford, and J. J. G.e.c. Paterson, Are we adapting to climate change? 2011. 21(1): p. 25–33.
- 2Jones, P.D., T. J. Osborn, and K. R. J.s. Briffa, The evolution of climate over the last millennium. 2001. 292(5517): p. 662–667.
- Milfont, T. L. J.P.a.t.s.C.t.i.t., research and practice, Global warming, climate change and human psychology. 2010. 19: p. 42.
- Qu, Y., et al., Future sea level rise along the coast of China and adjacent region under 1.5° C and 2.0° C global warming. 2020. 11(3): p. 227–238.
- Harman, I., et al., Assessment of future global scenarios for the Garnaut Climate Change Review: an application of the GIAM framework. 2008.
- Wang, Z., et al., Temperature dependence, spatial scale, and tree species diversity in eastern Asia and North America. 2009. 106(32): p. 13388–13392.
- Ghanbari, R., et al., Land surface temperature analysis in densely populated zones from the perspective of spectral indices and urban morphology. 2023. 20(3): p. 2883–2902.
- Yembuu, B., Climate and climate change of Mongolia, in The physical geography of Mongolia. 2021, Springer. p. 51–76.
- Angerer, J., et al., Climate change and ecosystems of Asia with emphasis on Inner Mongolia and Mongolia. 2008. 30(3): p. 46–51.
- Yuan, J., et al., Land use hotspots of the two largest landlocked countries: Kazakhstan and Mongolia. 2022. 14(8): p. 1805.
- Amnuaylojaroen, T. J. I.J.o.C., Intensification of Heat Extremes in Southeast Asia: Spatial–Temporal Analysis of Temperature Trends and Heat Events (1940–2023). 2025: p. e8907.
- Hossein-Panahi, B., et al., Case Studies Around the World, in Climate Change in Sustainable Water Resources Management. 2022, Springer. p. 361–414.
- Zhai, Y., Assessing factors contributing to the changes in historical temperature extremes and investigating future changes in extreme events. 2022: The University of Regina (Canada).
- Priyan, K. J. G.r.d. and p. i.t.s.-a. region, Issues and challenges of groundwater and surface water management in semi-arid regions. 2021: p. 1–17.
- Gao, F., et al., Identifying the impact of crop distribution on groundwater resources carrying capacity in groundwater-depended agricultural regions. 2022. 264: p. 107504.
- Tugjamba, N., Hydrography of Mongolia, in The Physical Geography of Mongolia. 2021, Springer. p. 77–100.
- Ganguli, R., Water in Mongolia: Sources, uses and issues, with special emphasis on mining, in Hindu Kush-Himalaya watersheds downhill: Landscape ecology and conservation perspectives. 2020, Springer. p. 813–822.
- Purevjav, B., Improving water management in mining regions through understanding stakeholders’ views and perspectives on integrated water resources management. 2024, University of British Columbia.
- Gomboev, B., et al., Assessing the Anthropogenically Caused Pollution of Water Bodies Within the Selenga River Basin on the Territory of Mongolia and Russia. 2020. 41(4): p. 372–380.
- Karthe, D., et al., Water and environment in the Selenga-Baikal Basin: international research cooperation for an ecoregion of global relevance. Vol. 23. 2016: Columbia University Press.
- Orkhonselenge, A. J. A.P., Climate-driven channel change of Orkhon River, Mongolia. 2022.
- Karthe, D., et al., Integrating multi-scale data for the assessment of water availability and quality in the Kharaa-Orkhon-Selenga river system. 2014. 7(3): p. 65–86.
- Yapiyev, V., et al., Essentials of endorheic basins and lakes: A review in the context of current and future water resource management and mitigation activities in Central Asia. 2017. 9(10): p. 798.
- McGrane, S. J. J. H. S. J., Impacts of urbanisation on hydrological and water quality dynamics, and urban water management: a review. 2016. 61(13): p. 2295–2311.
- Scanlon, B.R., et al., Global impacts of conversions from natural to agricultural ecosystems on water resources: Quantity versus quality. 2007. 43(3).
- Brumbaugh, W.G., et al., Environmental survey in the Tuul and Orkhon River basins of north-central Mongolia, 2010: metals and other elements in streambed sediment and floodplain soil. 2013. 185(11): p. 8991–9008.
- Karthe, D., et al., IWRM in a country under rapid transition: lessons learnt from the Kharaa River Basin, Mongolia. 2015. 73(2): p. 681–695.
- Dashdorj, B. Peak flow frequency analysis of the Orkhon River, Mongolia. in Proceedings of the Second International Conference on Resources and Technology (RESAT 2023). 2023. Springer Nature.
- Xuedong, L., et al., Sources and Risk Assessment of Heavy Metals in Sediments of the Orkhon River Basin in Mongolia. 2025. 48(5).
- Jin, S.-D., et al., Avifauna in the Orkhon River basin-A World Heritage site in Mongol. 2010. 3(1): p. 43–47.
- Lehmkuhl, F., et al., Holocene geomorphological processes and soil development as indicator for environmental change around Karakorum, Upper Orkhon Valley (Central Mongolia). 2011. 87(1): p. 31–44.
- Golubeva, L. J. I. G. R., Pleistocene and Holocene vegetation of Northern Mongolia (Selenga and Orkhon River basins). 1979. 21(12): p. 1365–1376.
- Amgalan, M., et al., Changes and Causes of Environmental Characteristics of Ogii Lake and Orkhon Valley, Mongolia. 2020. 18(4): p. 199–211.
- Asfaw, A., et al., Variability and time series trend analysis of rainfall and temperature in northcentral Ethiopia: A case study in Woleka sub-basin. Weather and climate extremes, 2018. 19: p. 29–41.
- Gedefaw, M., et al., Innovative trend analysis of annual and seasonal rainfall variability in Amhara regional state, Ethiopia. Atmosphere, 2018. 9(9): p. 326.
- Dorjsuren, B., et al., Study on Relationship of Land Cover Changes and Ecohydrological Processes of the Tuul River Basin. Sustainability, 2021. 13(3).
- Ma, X., et al., Spatial and temporal variation in rainfall erosivity in a Himalayan watershed. Catena, 2014. 121: p. 248–259.
- Demberel, O., et al., Relationship between Dynamics of Modern Glaciers of the Mt. Munkhkhairkhan (Mongolian Altai) and Climate. Water, 2023. 15(10): p. 1921.
- Enkhbold, A., et al., Impact of faults on the origin of lake depressions: a case study of Bayan Nuur depression, North-west Mongolia, Central Asia. Geogr Fis Din Quat, 2022. 44: p. 69–82.
- Erdenejargal, N., et al., Evaluation of the natural landscape aesthetic: a case study of Uvs province, Mongolia. Polish Journal of Environmental Studies, 2021. 30(5): p. 4497–4509.
- Girma, A., et al., Climate Change, Land Use, and Vegetation Evolution in the Upper Huai River Basin. Atmosphere, 2023. 14(3): p. 512.
- Wu, H., et al. Impacts of climate change and human activities on runoff in Weihe Basin based on Budyko hypothesis. in IOP Conference Series: Earth and Environmental Science. 2017. IOP Publishing.
- Wu, H. and H. Qian, Innovative trend analysis of annual and seasonal rainfall and extreme values in Shaanxi, China, since the 1950s. International Journal of Climatology, 2017. 37(5): p. 2582–2592.
- Cui, L., et al., Innovative trend analysis of annual and seasonal air temperature and rainfall in the Yangtze River Basin, China during 1960–2015. Journal of Atmospheric and Solar-Terrestrial Physics, 2017. 164: p. 48–59.
- Gedefaw, M., et al., Trend analysis of climatic and hydrological variables in the Awash river basin, Ethiopia. Water, 2018. 10(11): p. 1554.
- McFeeters, S.K., The use of the Normalized Difference Water Index (NDWI) in the delineation of open water features. International journal of remote sensing, 1996. 17(7): p. 1425–1432.
- Xu, H., Modification of normalised difference water index (NDWI) to enhance open water features in remotely sensed imagery. International journal of remote sensing, 2006. 27(14): p. 3025–3033.
- Mbanguka, R.P., et al., Water balance and level change of Lake Babati, Tanzania: sensitivity to hydroclimatic forcings. Water, 2016. 8(12): p. 572.
- Г.Даваа, Монгол орны гадаргын усны горим, нөөц. 2015, Улаанбаатар: Адмон принтинг.
- Chonokhuu, S., et al., Contamination and health risk assessment of heavy metals in the soil of major cities in Mongolia. International journal of environmental research and public health, 2019. 16(14): p. 2552.
- Li, J., et al., Estimating Effects of Natural and Anthropogenic Activities on Trophic Level of Inland Water: Analysis of Poyang Lake Basin, China, with Landsat-8 Observations. Remote Sensing, 2023. 15(6): p. 1618.
- Batima, P., et al., Observed climate change in Mongolia. Assess Imp Adapt Clim Change Work Pap, 2005. 12: p. 1–26.
- G.Davaa, Surface water regime resource of Mongolia, ed. G.Davaa. 2015, Ulaanbaatar.
- Dorjsuren, B., et al., Observed trends of climate and land cover changes in Lake Baikal basin. Environmental Earth Sciences, 2018. 77(20).

