Introduction
The research is devoted to the assessment of logistics and transport infrastructure and the analysis of the development of trade relations between Russia and China in the context of new geopolitical realities 2018–2024. The relevance of the work is due to the reorientation of Russia's foreign economic policy towards the east, the strengthening of China's role as a key trade and economic partner and the increasing importance of logistical factors in the formation of sustainable trade flows.
The purpose of the study is to identify the key factors determining the dynamics of bilateral trade, with an emphasis on the role of infrastructure, institutional conditions and sanctions pressure. The work uses an extended gravity model of international trade, which makes it possible to quantify the impact of macroeconomic, logistical and geopolitical factors on trade flows. The empirical base of the study includes statistical data from international and national sources for the period 2018–2024, and calculations were performed using econometric methods.
The results of the study show that the development of logistics infrastructure and increased trade freedom have a positive impact on trade between Russia and China, while sanctions restrictions have a statistically significant deterrent effect. The practical significance of the work lies in the possibility of using the findings in the development of state foreign economic policy, programs for the development of transport infrastructure and business strategies focused on Russian-Chinese economic cooperation.
Justification for the Selection of Countries for Analysis
The choice of countries for analysis is conditioned by the need to assess the transformation of Russia's foreign trade in the context of new geopolitical realities and identify differences in the dynamics of trade flows with key partners. For this purpose, three groups of countries were identified: the friendly states of the Eurasian region, the strategic partner China, and the unfriendly Western countries, with which trade has declined significantly since 2022. This approach allows for a comparative analysis and assessment of the impact of logistical, institutional and political factors on trade relations.
Belarus and Kazakhstan are considered friendly countries, characterized by a high degree of institutional integration with Russia, the presence of a common border and developed logistical connectivity. Their analysis makes it possible to assess the functioning of trade flows in conditions of minimal barriers and stable infrastructure links.
China is singled out in a separate category as Russia's largest trading partner, which plays a key role in the export of mineral resources and has a developed transport and logistics infrastructure. The analysis of Russian-Chinese trade makes it possible to identify the features of strategic interdependence and the reorientation of trade flows in the context of sanctions pressure.
The unfriendly countries include the United States, Germany and Spain, which until 2022 occupied an important place in Russia's foreign trade, but after the imposition of sanctions they faced a sharp reduction in trade relations. Their inclusion in the analysis makes it possible to assess the impact of sanctions and political factors on the structure of foreign trade and Russia's adaptation to changes in the geography of trade flows [4].
Thus, the selected set of countries provides a comprehensive assessment of the multidirectional trade trajectories and factors determining the modern structure of Russia's foreign trade.
Description of the Gravity Model
To quantify the impact of various factors on the volume of bilateral trade between Russia and China, this study uses regression analysis based on the gravity model of international trade.

The methodological goal is to empirically verify the interrelationships between economic, geographical, institutional and logistical variables and to determine their contribution to the formation of trade flow.
Here, the variables reflect both quantitative and qualitative aspects of trade relations between Russia and China. In this equation, Tij represents the volume of bilateral trade flows, GDPi and GDPj denote the gross domestic product of the trading countries. Geographical distance Dij reflects the physical separation between major trade centers of the two countries, directly affecting transportation costs. The logistic performance indexes LPIi and LPIj characterize the quality of logistics services, the effectiveness of customs procedures, transport infrastructure, and cargo traceability.
The inclusion of LPI in the model allows us to determine how improving the logistical characteristics of a country contributes to an increase in trade volumes. This variable is especially important for analyzing Russian-Chinese cooperation, since the development of transport corridors directly affects trade flows. TFIi and TFIj are the trade freedom index of Russia and partner-country. The index of trade freedom characterizes the degree of openness of the economy, the level of tariff and non-tariff restrictions. The higher the index value, the more liberalized foreign trade is. For Russia and China, this indicator reflects the impact of domestic trade policy on bilateral flows. SAN_level characterize a foreign policy barrier that restricts trade flows. The variable takes the value 1 for the duration of the sanctions and 0 in their absence. This factor makes it possible to quantify how external pressure affects trade exchange and how much China compensates Russia for the loss of Western markets.
The use of an extended gravity model makes it possible to take into account a wide range of factors affecting trade exchange between Russia and China. Economic indicators (GDP), geographical determinants (distance) and institutional parameters (sanctions, logistics, trade freedom index) provide a comprehensive analysis of the relationship between infrastructure development, political conditions and trade volume [1].
The least squares (OLS) method was chosen to estimate the model parameters due to its simplicity and reliability when performing standard econometric assumptions. However, to eliminate potential problems with heteroscedasticity and zero values of trade turnover, the use of the Poisson Pseudo Maximum Likelihood method (PPML) is also being considered.
Before performing the calculations, all the data was logarithmic to reduce the scale of the variables and present the coefficients as elasticities.
The calculation part of the study and the construction of econometric models were performed using EViews software, which has extensive functionality for analyzing panel data and applying various econometric modeling methods. The program provides tools for in-depth diagnostics, including checking for multicollinearity, autocorrelation, and heteroscedasticity, which improves the reliability and stability of the estimates obtained. The modeling results include coefficient values, indicators of their statistical significance, as well as measures of the quality of the specification, such as the coefficient of determination

Results and Interpretation of the Gravity Model
As part of this study, a gravity model of trade between Russia (source country) and 8 partner countries was constructed for the period from 2018 to 2024.
The dependent variable was Trade turnover, and the independent variables were: GDP of Russia (GDPi), GDP of partner countries (GDPj), free trade indices (TFIi, TFIj), logistics efficiency indices (LPIi, LPIj), Distance between countries (Distance), as well as the level of sanctions (SAN_level).
To assess the factors influencing the volume of trade turnover between Russia and partner countries, a gravity model using the least squares method (OLS) was used. OLS regression (Ordinary Least Squares) is a statistical method used to estimate the linear relationship between a dependent variable and one or more independent variables. The purpose of the method is to minimize the sum of the squares of the deviations of the observed values from those predicted by the model, which makes it possible to obtain the most accurate estimates of the parameters of the linear regression model.
Table 1
Ordinary Least Squares regression results
|
Trade turnover |
Coefficient |
Std. err. |
t |
P>|t| |
[0.025 |
0.975] |
|
Intercept |
0.0202 |
0.002 |
26.048 |
0.000 |
0.019 |
0.022 |
|
In_GDP_Rus |
0.5709 |
0.022 |
26.048 |
0.000 |
0.524 |
0.618 |
|
In_GDP_Patner |
0.1883 |
0.023 |
8.178 |
0.000 |
0.139 |
0.237 |
|
In_Distance |
-0.0164 |
0.008 |
-1.982 |
0.000 |
-0.034 |
0.001 |
|
Sanction_Level |
-0.3691 |
0.101 |
-2.990 |
0.000 |
-0.415 |
-0.020 |
|
In_TFI_Rus |
0.0816 |
0.003 |
26.048 |
0.020 |
0.075 |
0.088 |
|
In_TFI_Patner |
0.0698 |
0.005 |
14.630 |
0.000 |
0.060 |
0.080 |
|
In_LPI_Rus |
0.1262 |
0.005 |
26.048 |
0.000 |
0.116 |
0.136 |
|
In_LPI_Patner |
-0.0641 |
0.014 |
-4.610 |
0.000 |
-0.094 |
-0.034 |
China's GDP (ln_GDPi) shows a positive relationship with trade volumes (coefficient 0.5709) and has statistical significance (p = 0.000). This suggests that changes in Russian GDP have a significant short-term impact on its trade with partner countries, as Russia's trade potential is limited: sanctions pressure, logistical bottlenecks (ports, railway crossings), political distance with some countries, and technological dependence on unfriendly partners.
The GDP of the partner countries (ln_GDPj) turned out to be significant and positively related to trade (coefficient 0.1883; p = 0.000). This confirms the classical assumption of the gravity model: larger economies tend to have higher trade volumes. It indicates that the impact of the partners' GDP on trade is about 3 times weaker than the impact of Russia's GDP. This is because: Russia is the main exporter of resources, and the volume of exports is determined by Russia's domestic production potential (oil and gas, metals, fertilizers). Many partners — even very large economies (China, Kazakhstan) — import Russian goods based on specific industries, rather than the entire spectrum of their economy. Russia is more dependent on its own economic growth than on the growth of its partners.
The distance between countries (ln_Distance) has an expected negative but less significant coefficient (-0.0164; p = 0.066). The greater the distance between countries, the lower the volume of their mutual trade, which corresponds to the classical hypothesis of the gravity model. This is due to logistical and transportation costs that limit the intensity of trade with more distant countries. The negative ln_Distance coefficient (-0.0164) confirms the theoretical expectation of the gravity model: distance reduces trade turnover. However, the small value of the coefficient and the marginal statistical significance (p = 0.066) indicate that in modern conditions the influence of distance is significantly weaker than the influence of political, institutional and logistical factors. This reflects the specific structure of Russia's foreign trade, where the main partners are located geographically close (CIS, China), and restrictions on trade with remote countries are determined not by distance, but by sanctions.
The negative and statistically significant coefficient of the SAN_Level variable (-0.3691; p = 0.008) indicates a strong and steady decline in trade turnover with an increase in the level of sanctions pressure. A negative coefficient of -0.3691 means that an increase in the level of sanctions pressure between Russia and a partner country leads to a significant reduction in bilateral trade. Sanctions have a multiplier effect on the financial, logistical, and institutional elements of foreign trade, making them one of the most significant factors in the model. The result reflects a profound transformation in the structure of Russia's foreign economic relations, in which political constraints have a stronger impact on trade flows than geographical or economic parameters.
In_Trade_Freedom, the positive and statistically significant coefficients of the trade freedom indices for Russia (0.0816; p = 0.000) and partner countries (0.0698; p = 0.000) indicate that the liberalization of trade policy on both sides contributes to a significant increase in bilateral trade. The model demonstrates that the reduction of Russia's internal barriers has a stronger impact on trade dynamics than similar processes among partners, which is especially important in the context of sanctions and the reorientation of external relations. These results confirm the key position of the gravity model: the openness of trade policy is one of the most significant factors determining the intensity of international trade. Trade Freedom Index Russia activates trade ties in the face of sanctions. After 2014 and especially after 2022, Russia: It is forced to strengthen cooperation with «friendly» countries; removes bureaucratic barriers; speeds up customs procedures; expands parallel imports; increases the number of permitted categories of goods. Thus, the model shows that the deregulation of trade within Russia does increase trade turnover with partners.
In_LPi, the positive impact of Russia's logistics index (0.1262; p = 0.000) confirms that improving transport and customs infrastructure is a critical factor in the growth of foreign trade in the face of sanctions pressure and reorientation to Asian markets. On the contrary, there is a significant negative coefficient of the logistics index of the partner countries (-0.641; p = 0.000) reflects the structural «diversion effect» of trade flows: countries with highly developed logistics are more likely to focus on sustainable global destinations, while cooperation with Russia in conditions of high geopolitical uncertainty is perceived by them as riskier.
Thus, the model shows that the efficiency of the Russian logistics system stimulates the growth of trade, while a high level of logistics among partners can reduce trade turnover with Russia in the face of sanctions, redistributing their export-import flows in favor of alternative markets.
Trade flows with each of partner-country during 2018–2024 period
In this study, a panel approach was used to analyze the dynamics of Russia's bilateral trade with key partners in 2018–2024. At the first stage, a single gravity model was evaluated for all partner countries and all years, using fixed effects by country and year. At the second stage, based on the obtained model, the forecast values of trade turnover and balances for each pair of «Russia — partner country» were calculated in the context of years.
A comparison of the actual and forecast values made it possible to identify countries for which the volume of trade significantly exceeds or, conversely, does not reach the levels explained by classical determinants (GDP, distance, logistics, trade indices). Thus, for China and a number of CIS countries (Belarus, Kazakhstan) in 2022–2024, a steady excess of the actual trade turnover over the estimated level was recorded, which indicates a strategic deepening of economic cooperation. At the same time, the opposite pattern is observed for Germany, the United States and a number of other unfriendly countries: the actual trade turnover is significantly lower than forecast values, which indicates the dominant influence of sanctions and political factors over the economic determinants of trade.
Table 2
Ordinary Least Squares regression results for 2018
|
Year |
Reporter |
Partner |
Calculated Trade Flow |
Dist |
TFI Rus |
TFI Partner |
LPI Rus |
LPI Partner |
Sanction |
|
2018 |
Russia |
China |
10.0971 |
5000 |
58.2 |
57.8 |
2.76 |
3.61 |
0.5 |
|
2018 |
Russia |
Belarus |
6.9331 |
700 |
58.2 |
58.1 |
2.76 |
2.57 |
0.5 |
|
2018 |
Russia |
KZ |
5.7472 |
2300 |
58.2 |
69.1 |
2.76 |
2.81 |
0.8 |
|
2018 |
Russia |
Germany |
5.5214 |
1600 |
58.2 |
74.2 |
2.76 |
4.20 |
2 |
|
2018 |
Russia |
Spain |
4.7226 |
4000 |
58.2 |
65.1 |
2.76 |
3.83 |
2 |
|
2018 |
Russia |
US |
4.6093 |
7800 |
58.2 |
75.7 |
2.76 |
3.89 |
2 |
Table 3
Ordinary Least Squares regression results for 2019
|
Year |
Reporter |
Partner |
Calculated Trade Flow |
Dist |
TFI Rus |
TFI Partner |
LPI Rus |
LPI Partner |
Sanction |
|
2019 |
Russia |
China |
6.13458 |
5000 |
58.9 |
58.4 |
2.8 |
3.61 |
2 |
|
2019 |
Russia |
Belarus |
6.9173 |
700 |
58.9 |
57.9 |
2.8 |
2.58 |
0.5 |
|
2019 |
Russia |
KZ |
5.8744 |
2300 |
58.9 |
65.4 |
2.8 |
2.80 |
0.8 |
|
2019 |
Russia |
Germany |
5.3601 |
1600 |
58.9 |
73.5 |
2.8 |
4.19 |
2 |
|
2019 |
Russia |
Spain |
4.7881 |
4000 |
58.9 |
65.7 |
2.8 |
3.83 |
2 |
|
2019 |
Russia |
US |
4.6912 |
7800 |
58.9 |
76.8 |
2.8 |
3.88 |
2 |
Table 4
Ordinary Least Squares regression results for 2020
|
Year |
Reporter |
Partner |
Calculated Trade Flow |
Dist |
TFI Rus |
TFI Partner |
LPI Rus |
LPI Partner |
Sanction |
|
2020 |
Russia |
China |
6.8966 |
5000 |
61.0 |
59.5 |
2.87 |
3.62 |
2 |
|
2020 |
Russia |
Belarus |
6.4198 |
700 |
61.0 |
61.7 |
2.87 |
2.60 |
0.5 |
|
2020 |
Russia |
KZ |
5.7343 |
2300 |
61.0 |
69.6 |
2.87 |
2.78 |
0.8 |
|
2020 |
Russia |
Germany |
4.9111 |
1600 |
61.0 |
73.5 |
2.87 |
4.16 |
2 |
|
2020 |
Russia |
Spain |
4.3824 |
4000 |
61.0 |
76.6 |
2.87 |
3.86 |
2 |
|
2020 |
Russia |
US |
4.4658 |
7800 |
61.0 |
66.9 |
2.87 |
3.84 |
2 |
Table 5
Ordinary Least Squares regression results for 2021
|
Year |
Reporter |
Partner |
Calculated Trade Flow |
Dist |
TFI Rus |
TFI Partner |
LPI Rus |
LPI Partner |
Sanction |
|
2021 |
Russia |
China |
6.4399 |
5000 |
61.5 |
58.4 |
2.7 |
3.63 |
2 |
|
2021 |
Russia |
Belarus |
7.2402 |
700 |
61.5 |
61.0 |
2.7 |
2.63 |
0.5 |
|
2021 |
Russia |
KZ |
6.2688 |
2300 |
61.5 |
71.1 |
2.7 |
2.75 |
0.8 |
|
2021 |
Russia |
Germany |
5.5384 |
1600 |
61.5 |
72.5 |
2.7 |
4.12 |
2 |
|
2021 |
Russia |
Spain |
3.5186 |
4000 |
61.5 |
74.8 |
2.7 |
3.83 |
2 |
|
2021 |
Russia |
US |
5.1329 |
7800 |
61.5 |
69.9 |
2.7 |
3.85 |
2 |
Table 6
Ordinary Least Squares regression results for 2020
|
Year |
Reporter |
Partner |
Calculated Trade Flow |
Dist |
TFI Rus |
TFI Partner |
LPI Rus |
LPI Partner |
Sanction |
|
2022 |
Russia |
China |
6.7598 |
5000 |
56.1 |
48 |
2.6 |
3.64 |
2 |
|
2022 |
Russia |
Belarus |
5.4219 |
700 |
56.1 |
53 |
2.6 |
2.67 |
1.5 |
|
2022 |
Russia |
KZ |
5.3517 |
2300 |
56.1 |
64.4 |
2.6 |
2.72 |
1.8 |
|
2022 |
Russia |
Germany |
3.8213 |
1600 |
56.1 |
76.1 |
2.6 |
4.07 |
5 |
|
2022 |
Russia |
Spain |
3.5670 |
4000 |
56.1 |
72.1 |
2.6 |
3.8 |
5 |
|
2022 |
Russia |
US |
2.4041 |
7800 |
56.1 |
68.2 |
2.6 |
3.87 |
5 |
Table 7
Ordinary Least Squares regression results for 2023
|
Year |
Reporter |
Partner |
Calculated Trade Flow |
Dist |
TFI Rus |
TFI Partner |
LPI Rus |
LPI Partner |
Sanction |
|
2023 |
Russia |
China |
6.6547 |
5000 |
53.8 |
48.3 |
2.6 |
3.7 |
2 |
|
2023 |
Russia |
Belarus |
5.4056 |
700 |
53.8 |
51 |
2.6 |
2.7 |
1.5 |
|
2023 |
Russia |
KZ |
5.3493 |
2300 |
53.8 |
62.1 |
2.6 |
2.69 |
1.8 |
|
2023 |
Russia |
Germany |
2.8731 |
1600 |
53.8 |
73.7 |
2.6 |
4.01 |
5 |
|
2023 |
Russia |
Spain |
1.8572 |
4000 |
53.8 |
65 |
2.6 |
3.77 |
5 |
|
2023 |
Russia |
US |
2.6737 |
7800 |
53.8 |
70.6 |
2.6 |
3.9 |
5 |
Table 8
Ordinary Least Squares regression results for 2024
|
Year |
Reporter |
Partner |
Calculated Trade Flow |
Dist |
TFI Rus |
TFI Partner |
LPI Rus |
LPI Partner |
Sanction |
|
2024 |
Russia |
China |
6.7064 |
5000 |
52 |
48.5 |
2.64 |
3.65 |
2 |
|
2024 |
Russia |
Belarus |
5.3707 |
700 |
52 |
48.4 |
2.64 |
2.71 |
1.5 |
|
2024 |
Russia |
KZ |
5.3495 |
2300 |
52 |
62 |
2.64 |
2.7 |
1.8 |
|
2024 |
Russia |
Germany |
2.8162 |
1600 |
52 |
72.1 |
2.64 |
4.1 |
5 |
|
2024 |
Russia |
Spain |
1.8465 |
4000 |
52 |
63.3 |
2.64 |
3.8 |
5 |
|
2024 |
Russia |
US |
2.5725 |
7800 |
52 |
70.1 |
2.64 |
3.93 |
5 |
Evaluating the gravity model for each year separately for the period 2018–2024 provides a wide range of analytical opportunities to identify the dynamics of the impact of key economic, institutional and logistical factors on Russia's trade relations with partner countries. The researcher receives a valuable body of information reflecting how the structural logic of Russian foreign trade has changed in the context of the transformation of the global economic and political environment.
The aggregated graph of trade turnover calculated using the gravity model for 2018–2024, presented as a total area, allows us to assess not only the individual dynamics of each partner country, but also the overall structure and direction of changes in Russia's foreign trade over the period under review. Taken together, the data demonstrate a consistent decline in the total trade potential reflected by the model, which is consistent with the profound geopolitical, logistical and institutional transformations that took place after 2020 and especially after the start of sanctions restrictions in 2022.
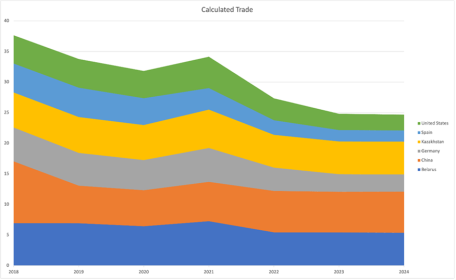
Fig. 1. Dynamics of the total area of trade turnover for partner countries
The comparison showed that for China, as well as for Belarus and Kazakhstan in 2022–2024, the actual volume of trade steadily exceeds the level explained by the classical factors of the gravity model. This indicates the strategic deepening of economic cooperation and the reorientation of Russian trade flows in favor of friendly countries. In contrast, for the United States, Germany and Spain, the actual trade turnover is significantly lower than forecast values, which indicates the dominant influence of sanctions and political factors over the economic determinants of trade.
The aggregated schedule of estimated trade turnover for 2018–2024 reflects the overall decline in Russia's trade potential, especially after 2022. The sharpest reduction is in unfriendly countries, whose share in the total trade structure is significantly decreasing by 2023–2024, practically decreasing to a minimum. This reflects the disruption of traditional logistics chains and the cessation of technological and financial cooperation [5].
At the same time, the indicators of Belarus, Kazakhstan and China demonstrate relative stability throughout the period. Belarus remains the most stable partner, Kazakhstan is moderately volatile within the EAEU, and China retains a key role in the structure of trade flows, offsetting the decline in trade with Western countries. Visually, this is reflected in the growth of China's relative share after 2022.
In general, the results confirm that after 2022, the structure of Russia's foreign trade has undergone a profound transformation: trade flows with unfriendly countries have sharply decreased, while cooperation with China and the countries.
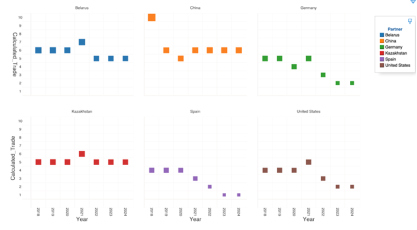
Fig. 2. Visualization of trade flows of OLS regression for each country by 2018–2024 years respectfully
A separate gravity model containing key variables is evaluated for each year. Comparing the coefficients by year makes it possible to identify structural transitions: The presented graphs demonstrate differences in the trajectories of Russia's trade relations with friendly countries in the region, strategic partners and states included in the sanction’s regime, which confirms the structural transformation of the international trade of the Russian Federation [3].
The graphs show the values of Russia's trade turnover with six countries calculated by the model: Belarus, Kazakhstan, China, Germany, Spain, and the United States. It can be seen that each country demonstrates its own unique dynamics, which reflects both the partner's economic characteristics and the influence of external geopolitical and infrastructural factors.
The simulation results show that Russia's trade with Belarus and Kazakhstan is characterized by high stability throughout the analyzed period. For Belarus, this is due to the common border, deep institutional integration within the EAEU, the absence of sanctions barriers and the synchronization of logistics chains. Kazakhstan is showing similar dynamics with moderate fluctuations and short-term growth in 2021, which may be due to the restoration of logistics after the pandemic and the strengthening of its role as a transit hub. After 2022, trade indicators will stabilize again, despite the general sanctions pressure.
China occupies a special position in the structure of Russia's trade relations. The model captures a consistently high level of calculated trade turnover throughout the entire period, reflecting the strategic nature of the partnership, the development of infrastructure and energy projects, and the reorientation of Russian trade to the east. Even after 2022, the calculated values remain stable, underscoring the long-term sustainability of Russian-Chinese economic ties.
In contrast, the dynamics of trade with Western countries — Germany, Spain, and the United States — show a sharp and steady decline after 2021–2022. Before the introduction of large-scale sanctions, their trade performance was at a moderate level, but the subsequent decline reflects the dominant impact of sanctions, political restrictions and the destruction of pre-existing logistical and economic ties.
Overall, a comparison of the results for all countries shows a clear differentiation of trade trajectories. Trade with Belarus, Kazakhstan and China remains stable and of strategic importance, while economic ties with Western countries are sharply declining. This confirms that in the period 2018–2024, Russia's foreign trade underwent a systemic transformation, expressed in the strengthening of the Eurasian and Asian directions and at the same time reducing interaction with Western economies.
Thus, the dynamics of the calculated values of the gravity model shows that in the period 2018–2024, the structure of Russia's foreign trade underwent systemic changes. The strengthening of trade with China and the countries of the Eurasian Economic Union is taking place in parallel with the reduction of economic ties with Western countries, reflecting the general geopolitical reorientation and the formation of new trade and logistics contours of Eurasia.
References:
- James E. Anderson. The gravity model. National Bureau of Economic Research; 2010.
- Shahriar Saleh, Qian Lu, Kea Sokvibol, Muhammad Abdullahi Nazir. The Gravity Model of Trade: A Theoretical Perspective; 2019.
- Шумилов А. В. Оценивание гравитационных моделей международной торговли: обзор основных подходов. Экономический журнал ВШЭ. 2017;21(2):224–250.
- Лу Наньцюань. Влияние санкций США и ЕС на российскую экономику и китайско-российские торгово-экономические отношения // Журнал Хэйхэского института. 2022. № 12. C. 1–5.
- Wang Zhiyuan The impact of Western economic sanctions on Sino-Russian Trade. Modern Economy Success. 2023. 2. P. 338–344.

