This study applies the latter methodology for monitoring desertification using soil degradation zones in the Kurshim district (East Kazakhstan region. Kazakhstan). The approach involves the comparison of spectral characteristics of the soils in Landsat Thematic Mapper (TM) images over a 24-year period (1991, 1996, 2001, 2010, and 2015).
Keywords : desertification, research, remote sensing, monitoring and climate.
В данной работе применяется последняя методология мониторинга опустынивания с использованием зон деградации почв в Куршимском районе (Восточно-Казахстанская область, Республика Казахстан). Подход включает сравнение спектральных характеристик почв на изображениях Landsat Thematic Mapper (TM) за 24-летний период (1991, 1996, 2001, 2010 и 2015).
Ключевые слова : опустынивание, исследования, дистанционное зондирование, мониторинг и климат.
Central Asia is one of the most arid regions in the world. The water supply of the region largely depends on mountain rivers. Mountain rivers are fed by glaciers and the flow regime of the river in spring and summer depends on the accumulation of snow in the winter months. The volume of meltwater from seasonal snow cover in the mountains may be different. Therefore, for the economic development and social security of the region, it is important to be able to accurately calculate this amount.
The average and maximum of the highest decadal heights of snow cover during the winter (Table 1, columns 1 and 2) are calculated from daily observations of the height of snow cover on three rails installed in an open area within the locality. According to these data, the average decadal values of the snow cover height were determined. From them, the maximum values were selected for each winter, according to which the average of the largest and the maximum value for the observation period of at least 40 years were found. On this small area, snow can be inflated and demolished.
Table 1
Snow cover [ 1 ]
|
Region, town |
Snow cover height, cm |
Duration of occurrence of stable snow cover, days | ||
|
the average of the largest decadal for the winter |
the maximum of the greatest decadal |
maximum daily allowance for winter on the last day of the decade | ||
|
East-Kazakhstan region | ||||
|
Zaysan |
26.2 |
73.0 |
69.0 |
136.0 |
|
Katon-Karagay |
26.9 |
89.0 |
48.0 |
160.0 |
|
Oskemen |
57.4 |
104.0 |
- |
147.0 |
|
Shemonaikha |
49 |
83 |
85 |
151 |
The maximum daily height (Table 1, column 3) is defined as the highest of the maximum values of the snow cover height for the year, obtained from snow surveys in the field conducted on the last day of each decade. The data of snow surveys represent the average value of 100 measurements along a one- to two-kilometer route and are therefore more reliable and stable.
The duration of the occurrence of stable snow cover (Table 1, column 4) is defined as the average of the annual periods of stable snow cover. The period of occurrence of snow cover is determined between the date of formation of a stable snow cover, when the area of the visible vicinity of the meteorological station is more than 60 % covered with snow, and the date of destruction of the stable cover, when the degree of coverage of the neighborhood becomes less than 60 %. Moreover, a stable snow cover is considered if it persists for at least 30 days with breaks of no more than three days in a row.
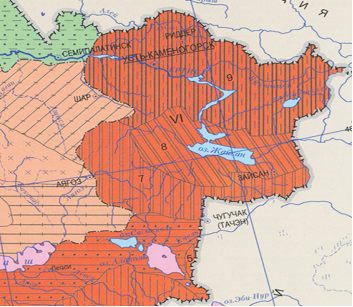
The study area is located in the eastern part of Kazakhstan. It comprises 97,800 km2 within soils of mountainous territories and areas with sandy and underdeveloped soils. The region lies between latitudes 48°52’54.98” N and 48°31’44.43’’N and longitudes 83°31’46.61” E to 82°51’56.43” E.
Figure 1 shows the location of the study area and also the extent of imagery that was used in this research. The information on the environment of the study area that is presented in this chapter has been drawn from the Kazakhstan Soil Conservation District plan and lease assessment overview report on the Kazakhstan Soil Conservation Districts (Virtual Encyclopedia of the Steppes. Natural conditions and resources 2010).
VI — Orogenic belt.
7 — Tarbagatai and Sauyr Mountains
8 — accumulative and denudation plains of the Zaisan depression
9 — Ridges of the Kazakh part of Altai Mountains [2].

Fig. 1. Location of study area
The choice of study area was influenced by the history of land condition assessment and the availability of spatial and ecological data. The Pastoral Management Branchthe of Department of Water, Land and Biodiversity Conservation of East Kazakhstan established permanent monitoring sites throughout these districts in 1991 to record changes in land condition over time using sampling and photographic methods. They also recorded land system characteristics of the area and assessed land condition using the land condition index method.
A second round of land condition assessment of the area was conducted in 2021 at a smaller sample of permanent monitoring sites. This time span from 1991 to 2021 enabled detection of changes in vegetation cover and land condition over time. The field data that was collected in 1991, 1996, 2001, 2006, 2011, 2016 and 2021 as a part of these assessments was used to validate remote sensing techniques that were applied in this study to the study area.
Landsat Thematic Mapper (TM) images and raster-based topographical maps were obtained from the United States Geological Survey (USGS). Each image was clipped to coincide with the corresponding 7.5 minute DEM tile obtained from the NASA Shuttle Radar Topographic Mission (SRTM). Images were gathered for a 31-year period (August 1991, August 1996, August 2001, August 2006, August 2011, August 2016, and August 2021) documented.
Aerial photography (1:20,000) provided by the USGS augmented the data for visualization purposes and for visual assessments of classification precision. Atmospheric corrections (ATCOR3) were run on the Landsat scenes using environmental data from the Mitchell Caverns weather station (the closest weather station to the East Kazakhstan); general elevations for ATCOR3 were obtained from the DEM data and were used to correct for regional cosine errors. After running the atmospheric corrections, masks were created to constrain calculations to the Kazakhstan. Results from these calculations would be used to distinguish between active and inactive desert soils.
Using methods outlined by Blount [3], contrast enhancements were applied to the Landsat data, including Gaussian stretches on bands 5, 4, and 1. The active and inactive dunes were distinguished by spectral brightness, as defined by Blount [3], where active dunes appear brighter than inactive dunes. Band threshold values were used that split the bimodal distribution of brightness values between active and inactive dune pixels and approximate a function that is equidistant from the pairs of curves on each graph of Figure 2.4.
Dune type was classified according to morphological criteria defined by Breed and Grow [4] and individual dunes were identified following the criteria in McKee [5] who noted that although no single type of evidence is conclusive in an aeolian environment, together, the various features present strong evidence of dune deposition. McKee [5] focused on the analysis of slip faces, extent of the sand body, ripple marks, and the slope to define an individual dune. Informal assessment of accuracy was done by comparing the dune classifications to air photos acquired for periods corresponding to the imagery. Further, change detection was assessed by pairwise comparisons of the classified images.
To determine the extent of desertification, the dune environments were visualized in plan-view and in 3D to gain a better spatial context using Terrain Analysis System (TAS) software [6]. The movement of sand at the Kurshim districr was assessed temporally by comparing the five images of the Kurshim district representing the 31-year period. Images from each year were overlain to visualize the degree of southeastward shift. Encroachment (the rate of sand movement into new territory) was computed based on the method described by BenDor et al. [7]; lines representing the sand front were joined for three images obtained at the different time periods to form a polygon that depicted the total area covered by sand during those years.
There is a clear distinction between the spectral signatures of active and inactive dunes. One-way Analysis of Variance (ANOVA) tests were performed on the zonal statistics for each TM-band; results indicate that mean brightness values differ significantly between active and inactive dune areas for each spectral band (P < 0.05). Figure 24 contains a summary of the average brightness of active and inactive dune pixels, averaged across the 5 individual years of data spanning the 24-year study period. Active and inactive dunes are easily separated because the inactive dunes are spectrally darker than the active dunes, with the greatest differences being in TM-3.
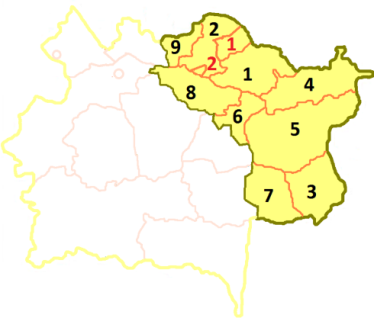
As sand becomes more active, the particles become better sorted and presence of coarse grains decreases [13]. Since active and inactive sand dunes are partially characterized by an increasing degree of relatively visualization of the satellite data coincidently with vegetation data acquired from air photos helps to aid with interpretation and assessments of activity. As sand becomes increasingly active, vegetation cover is reduced; additionally, these areas become increasingly covered by active wind ripples and the slip faces become more developed [8]. Paisley et al. [8] confirm the relationship between sand activity and vegetation; they observed that the spectral characteristics for dunes, such as those at Kurshim, can be used to distinguish between active and inactive dunes in other regions too (Figure 2).

Fig. 2: East Kazakhstan region
Black colour: 1 — Altai district, 2 — Glubokoe district, 3 — Zaysan district, 4 — Katon-Karagay district, 5 — Kurshim district, 6 — Samarskoe district, 7 — Tarbagatai district, 8 — Ulan district, 9 — Shemonaikha district
Red colour: 1 — Ridder town, 2 — Oskemen
The southeastern region of the Kurshim district is inactive; this region appears the darkest in tone on the Landsat TM images and appears the most stabilized. Active soils are easier to identify than inactive soila, especially when compared with vegetative data, the loss of which is depicted in Landsat images, primarily on TM-4. Thus, the difference in spectral reflectance can be explained by the presence of vegetation as seen in the Landsat TM band. Visually, active dunes have a well-sorted morphology and sparse vegetation cover [9]; however, inactive dunes are more difficult to distinguish as they present a wider range of characteristics that are not as easily defined and more factors need to be considered. Generally, inactive dunes tend to have reduced lee face angles, are more vegetated, and have moderately-to-poorly sorted sand [10]. Transitions between active and inactive dunes are particularly complex and difficult to identify, but can greatly affect the regional image classification [10]. Pair-wise comparisons of the images for the 24-year period indicate that the advancement rate of sand within the Kurshim experienced an encroachment rate of approximately 5.9 m3/m/yr, with advancement accelerating towards the latter half (Table 2).
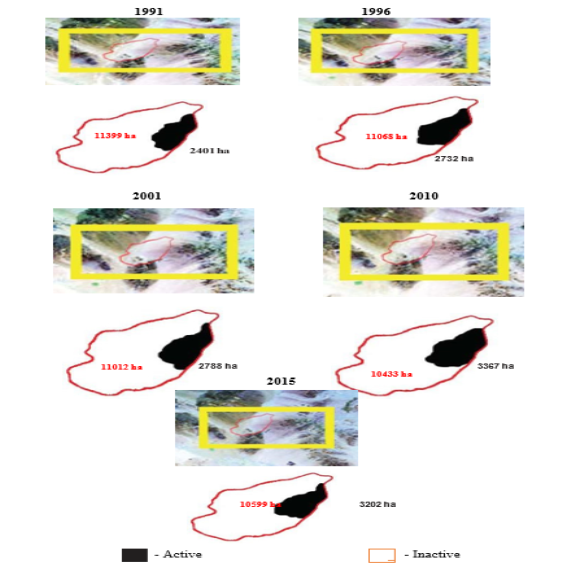
The spatial pattern of vegetation cover suggests that vegetation does not have a large influence on the TM spectra of arid regions and therefore, with less than 35 % of vegetation cover in the Kurshim district, vegetation should not be the basis of desertification assessment. The TM spectrum is influenced more by the spectral differences between active and inactive sand than by vegetation (Figure 3).

Fig. 3. Flow diagram to illustrate data processing steps: mask created for Kurshim district in Landsat images (yellow frame), active and inactive dunes identified (in hectares), and computed brightness values. Graphs portray average, minimum, and maximum brightness values for each spectral band
Table 2
The advancement rate recorded during the 24-year period from 1991 to 2015 for the Kurshim district
|
Year |
Advancement Rate (m 3 m −1 yr −1 ) |
|
1991 to 1996 |
2.8 |
|
1996 to 2001 |
3.7 |
|
2001 to 2006 |
4.4 |
|
2006 to 2011 |
5.9 |
|
2011 to 2015 |
6.3 |
Analysis of the spatial patterns of sand encroachment indicated that the sand at the top of the active places at Kurshim is subject to more movement than sand at the base of the active area likely due to increased exposure to stronger winds (speculation statement supported by Paisley et al. [8] and Lancaster [10]). However, it is not clear whether sand grain size has an effect on the distribution of inactive sand and whether the evidence of desertification is influenced not only by humans, but also by climatic change.
We suggest that anthropogenic activity at the Kurshim is one possible cause for the acceleration of sand encroachment, since the documented climate variations during the study period were small, with only minor and consistent fluctuations. However, further research would be required to make a definitive assessment.
References:
- АО «КазНИИСА». СП РК 2.04–01–2017. Строительная климатология. Астана 2017. Снежный покров 27 стр.
- Map geomorphological regionalization of the Republic of Kazakhstan. National atlas of the Republic of Kazakhstan, volume 1, Natural conditions and resources. Almaty, 2010. — P.51. https://steppes.kspi.kz/pages/Kazakhstan.html
- Runnstrom, M. C. Is Northern China winning the battle against desertification? Satellite remote sensing as a tool to study biomass trends on the Ordos Plateau in semiarid China. Ambio 2000, 29, 468–476.
- Breed, C.S.; Grow, T. Morphology and distribution of dunes in sand seas observed by remote sensing. In A Study of Global Sand Seas (USGS Professional Paper1052); McKee, E.D., Ed.; US Government Printing Office: Reston, VA, USA, 1979; pp. 253–302.
- McKee, E. D. Introduction to a study of global sand seas. In A Study of Global Sand Seas; McKee, E.D., Ed.; United States Geological Survey: Reston, VA, USA, 1979; pp. 3–19.
- Lindsay, J. B. The Terrain Analysis System: A tool for hydro-geomorphic applications. Hydrol. Processes 2005, 19, 1123–1130.
- Ben-Dor, E.; Levin, N.; Singer, A.; Karnieli, A.; Braun, O.; Kidron, G. J. Quantitative mapping of the soil rubification process on sand dunes using an airborne hyperspectral sensor. Geoderma 2006, 131, 1–21.
- Paisley, E. C. I.; Lancaster, N.; Gaddis, L.R.; Greeley, R. Discrimination of active and inactive sand from remote sensing: Kelso Dunes, Mojave Desert, California. Remote Sens. Environ. 1991, 37, 153–166.
- Barbour, M.G.; Burk, J.H.; Pitts, W.D.; Gilliam, F.S.; Schwartz, M. W. Terrestrial Plant Ecology, 3rd ed.; Benjamin Cummings, Addison Wesley Longman Inc.: San Francisco, CA, USA, 1999; pp. 38–59.
- Karnieli, A. Development and implementation of spectral crust index over dune sands. Int. J. Remote Sens. 1997, 18, 1207–1220

