Soil and water studies are important for sustainable agriculture and natural resources management. Near-surface soil water plays a fundamental role in the land-atmosphere water exchange process. A development of adequate soil moisture monitoring technique contributes on better management of soil, plants, irrigation, and groundwater resources. This research was conducted to investigate an estimation method of volumetric soil water content (SWC) from land-surface temperature (TS) and apply the SWC estimation technique to Afghanistan using satellite thermal observation data. In total eight sets of field experiment, including preliminary experiment, were conducted in University of Miyazaki research field during March to December, 2013. During the experiment, the relationship between TS and SWC was investigated by measuring TS for soil samples having variety of SWC levels. In main field experiment Ts of the soils having seven different SWC levels were measured in total six clear-sky days (0, 10, 20, 30, 40, 50 and 60 %, as well as 0, 5, 10, 15, 20, 25 and 30 %). In conclusion; surface of the driest soil had the highest TS. TS decreased as SWC increased for dry to moderate SWC range, and decrement of TS stopped when SWC reached to certain level, which was 25 %. Adequacy of estimated SWC was evaluated by comparing the results of SWC with (NDVI), which took triangle shape. According to this fact, the relations between SWC and NDVI support a successful estimation of relative soil water content with the spatial distribution in Baghlan Afghanistan.
Keywords: soil water content, land-surface temperature, NDVI.
Исследования почвы и воды важны для устойчивого сельского хозяйства и управления природными ресурсами. Приповерхностные почвенные воды играют фундаментальную роль в процессе водообмена между сушей и атмосферой. Разработка адекватных методов мониторинга влажности почвы способствует лучшему управлению почвой, растениями, ирригацией и ресурсами подземных вод. Это исследование было проведено для исследования метода оценки объемного содержания влаги в почве (SWC) по температуре поверхности земли (TS) и применения метода оценки SWC к Афганистану с использованием данных спутниковых тепловых наблюдений. Всего с марта по декабрь 2013 г. на исследовательском поле Университета Миядзаки было проведено восемь серий полевых экспериментов, включая предварительный эксперимент. В ходе эксперимента взаимосвязь между TS и SWC была исследована путем измерения TS для образцов почвы с различными уровнями SWC. В основном полевом опыте TS почв с семью различными уровнями SWC измеряли всего за шесть дней безоблачного неба (0, 10, 20, 30, 40, 50 и 60 %, а также 0, 5, 10, 15, 20 %, 25 и 30 %). В результате поверхность самой сухой почвы имела самую высокую TS. TS уменьшалась по мере увеличения SWC для диапазона SWC от сухого до умеренного, а снижение TS прекращалось, когда SWC достигала определенного уровня, который составлял 25 %. Адекватность рассчитанного SWC оценивали путем сравнения результатов SWC с (NDVI), который принял форму треугольника. Согласно этому факту, отношения между SWC и NDVI поддерживают успешную оценку относительного содержания влаги в почве с пространственным распределением в Баглане, Афганистан.
Ключевые слова: вода, почва, температура, растений, влажность и орошение.
Soil moisture (SM) and vegetation are interdependently related, soil and water studies important for sustainable agriculture and natural resources management (Breshears and Barnes, 1999). Crop yields are more often determined by the amount of accessible water rather than the deficiency of other elements. Near-surface soil water plays a fundamental role in the land-atmosphere water exchange process because it reins both evaporation from bare soil and transpiration from vegetated areas. Soil moisture variability affects growth and survival of vegetation. Stephenson (1990) pointed out that changes in vegetation are caused by changes in SM regimes and other soil properties, which are directly affected by climate changes. In climates with a wet season, modifications to rainfall patterns produce alternations in the biological cycle of plants by affecting the availability of soil water (Mendez-Barroso et al., 2009). When the levels of soil water fall below the specific threshold for a species the plants undergo water stress, and the decrease in SM under warmer conditions can inhibit photosynthesis (Lindroth et al., 1998). As well as physiologically affecting individual types of vegetation, temporal and spatial soil moisture determines the distribution of species in any geographic area (Canadell and Zedler, 1995). Similarly, small changes in SM can cause differences in vegetation composition between adjacent areas (Daubenmire, 1968).
As far as agriculture is concerned, soil water content (SWC) variation in the vadose zone is very important in applications such as field water balance, vegetation growth, nutrients absorption and contaminant transport (Wijewardana, L. W. Galagedara, 2010). Measurement of SWC variability is complicated due to soil heterogeneity and various environmental variabilities. No single efficient method has been developed to map high or low soil moisture zones at the field scale without disturbing the soil and water flow paths (Galagedara, 2003). Rapid assessment and monitoring of SWC over large areas is therefore necessary in order to achieve efficient water management at field scale. SWC monitoring is also important for addressing issues of water quantity and quality, both relevant for managing the environmental impacts of irrigated agriculture and for protecting functional ecosystems (Rubin, 2003).
The amount of water infiltrating the soil surface directly affects the quantity of surface runoff and erosion. Soil infiltration during a rainstorm is closely related to a number of factors such as the intensity and kinetic energy of the rainfall, soil surface conditions and soil properties such as those related to aggregate stability, e.g. texture and organic matter content, as well as the antecedent or initial soil water content (Truman et al.,1990; Le Bissonnais and Singer, 1992; Hawke et al.,2006). These factors are very important. According to Charlesworth (2005) SWC can be determined gravimetrically. This involves removing a portion of soil from the sample site, so it is not appropriate for continual long term monitoring.
Numerous studies of soil moisture estimation from remote sensing mainly focus on microwave and optical remote sensing (Ahmad et al., 2010; Das et al., 2008; Ghulam et al., 2007; Mallick et al., 2009; Njoku and Entekhabi., 1996; Paloscia et al., 2006; Pierdicca et al., 2010; Sano et al., 1998; Vivoni et al., 2008; Zhang and Wegehenkel., 2006). Microwave sensors (including active and passive) have extensive weather sensing capabilities and can operate during the whole day and night, consequently they have occupied an important place in monitoring surface soil moisture (Zhao et al., 2010). However microwave sensors still have some limitations in comparison with the commonly used optical remote sensing data, such as Moderate Resolution Imaging Spectroradiometer (MODIS), Landsat Image.
It is well known; management and knowing SWC strongly helps to manage soil, plants, irrigation, land systems, pollution detection and ground water in principle. On the other hand, soil erosion which is a major global environmental problems can result in negative impacts that limit the sustainable development of economics and societies (Zhang, 2014). Inadequate watershed management cause the loss of fertile soil result in serious silting in streams, rivers and reservoirs. Thus management of SWC is a key factor for avoiding of such threats. Soil erodibility, surface run-off and evaporation strongly related on SWC and soil characteristics.
The objectives of this research were to investigate the possibility estimating of soil moisture from land surface temperature measurement, to know the relationships between surface temperature, soil water content, and the application to Baghlan province of Afghanistan. A set of field experiment was designed in University of Miyazaki (UOM) research farm, using soil samples having different soil water contents. The results of field experiments conducted in UOM research farm has then assimilated and compared with satellite-based thermal data for Khawja-alwan plateau of Baghlan, Afghanistan to examine the applicability of the Japanese field-based knowledge in Afghanistan. The application of satellite data is useful for understanding the status of soil moisture over a wide area, because such data provide spatial and temporal information of the soil surface (Tasumi and Kimura, 2013). This technique will pave the way for contribution of soil and water conservation management in Afghanistan.
Materials and methods
This study investigated a relationship between SWC and Ts, through field research at UOM research field. Geographically located in 31º 49′ 39.7″ N, 131º 24′ 40″ E with altitude of 36.8 m. This research started on March 16, 2013. Soil of research field has located into oven-dryer machine for 24 hours at 105 oC. Oven-dried soil was then filtered (2 mm). Experimental conditions have limited as clear-sky days, because the result in further applied with satellite imagery obtainable in clear-sky days only. And also investigated surface condition was fixed as bare-soil surface with no-vegetation cover. During the field experiment, soil samples having varieties of SWC were placed in the UOM research field, and Ts measurements were conducted. The relationship of SWC and Ts obtained by the field experiment was then applied with Landsat satellite imagery of Baghlan Afghanistan, and SWC of the area was estimated.
Preliminary experiment for container selection
Experiment associated with depth for different types of container with oven-dried soil was performed to see the surface temperature variations (figure 1).
Preliminary experiment was conducted in two days (Mar. 16 and Apr. 11, 2013) to determine the size and the type of soil container used in the main experiment. For selecting suitable containers, the five different types of containers were examined (Table 1). In the preliminary experiment, oven-dry «Andosoils» (Andosoils is the name of soil in the UOM research field) were filled into the five containers, and the difference of surface temperature by the type of container was investigated.
Table 1
Summary of five containers investigated in the preliminary experiment
|
No. |
Type |
Made |
Size (approx.) W*D*H or D*H, cm |
Volume (meas.) cm 3 |
|
1 |
Box, Shallow |
Plastic |
15*20*6 |
1820 |
|
2 |
Box, Shallow |
Metal |
16*22*5 |
1850 |
|
3 |
Vessel, Medium |
Metal |
16*18 |
3180 |
|
4 |
Vessel, Medium |
Plastic |
16*19 |
3900 |
|
5 |
Vessel, Deep |
Plastic |
16*30 |
6000 |
By the result of the preliminary experiment, a basic assumption is that a small and shallow about (e.g. 10 cm depth) container made by any material is sufficient. After performing of some experiment on this subject, it has decided to use a shallow plastic container (Nakaya Kagaku Sangyo Co., Ltd. K233; W*D*H= about 23.5*17*8.5 cm, V =3000 cm3). Not like air and soil temperature, Ts is constructed by instantaneous radiation balance and heat transfer at «surface», which does not have heat capacity. Conditions of deeper soil might not affects the surface process, for example, a literature indicates that soil moisture more than 10 or 15 cm depth from bare soil surface does not immediately affects to surface heat balance (Allen et al., 1998). However, the assumption should be better checked. In this step of experiment, oven-dried soils were filled into the containers with different sizes and/or materials and were placed in the field to make the inside soil surface be the same level with land surface. For Ts measurements, infrared thermometer by Shinwa Rules Co., Ltd. 73010B (emissivity = 0.95, distance factor = 12:1, and measurement accuracy = plus-minus 2oC) was used. Emissivity is the ability of an object to emit or absorb energy. Perfect emitters have an emissivity of 1, means emitting 100 % of incident energy, as well as an object with emissivity of 0.8 will absorb 80 % and reflect 20 % of the incident energy.
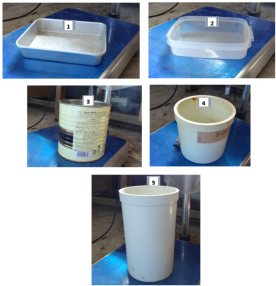
Fig. 1. Five containers used in preliminary experiment
Main field experiment
In the main field experiment, the soil having volumetric water contents of 0, 10, 20, 30, 40, 50, and 60 percent was filled into the selected container (figure 2), and the impacts of SM to Ts were investigated. Based on the results, for investigation of more accurately the relationship between SWC and Ts, the volumetric water contents of soil changed to 0, 5, 10, 15, 20, 25, and 30 percent. Throughout the preliminary and the main field experiments, controlling the dry density of soil in the containers are ideal. However controlling the dry density was technically difficult. In preliminary experiment, the soil densities of the five tested containers were almost the same, because the same dry soils were filled with same manner. In main field experiment, density did not control, but it has recorded to evaluate the impact of soil density later if necessary. Considering «fetch» is very important in general weather measurement. However this experiment is not weather but the «surface» measurement (measurement height is zero cm). Thus, it has assumed that considering fetch is not necessary. Ts of the soils having seven different SWC levels was measured at UOM research farm in total six clear-sky days during 2013 (0, 10, 20, 30, 40, 50, and 60 percent in May 8 and 24, and in Jun 18, 2013; and 0, 5, 10, 15, 20, 25 and 30 percent in Aug. 11, Nov. 29 and Dec. 4, 2013). The relationship between Ts and SWC was analyzed, and the applicability of the SWC estimation from satellite measured Ts was investigated. The measurement timing and frequency was not consistent during the six days of field experiment. To treat the six results consistently, 30 minutes dataset from 7:30 to 17:00 was derived by each original measurement using spline interpolation.
Abstracting a general knowledge from the results of the field experiment is important to apply the obtained relationship between Ts and SWC to other regions. Tasumi and Kimura (2013) suggested that SWC is in proportion to a temperature index called ETf from dry to moderate SM conditions, where ETf is expressed as; ETf = ((Ts (dry) ‒ Ts (act)) ⁄ ((Ts (dry) ‒ Ts (wet)), where Ts (dry), Ts (act), Ts (wet) are dry, actual, and wet surface temperatures respectively. ETf varies from 0 to usually about 1 based on the surface conditions. ETf = 0, show that there is no water, dry surface, and the surface has no ET, [Ts (act) ═ Ts (dry)]. ETf is one, means the surface is wet, [Ts (act) ═ Ts (wet)].
ETf ═

Where ETf indicates the evapotranspiration efficiency of the surface.
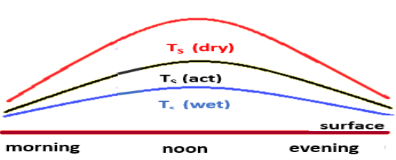
Fig. 2. the relationship between SWC and Ts
Proportionality of the SWC and ETf was tested for 10:30 am (a typical observation time for Landsat satellite) using the results of field measurement.
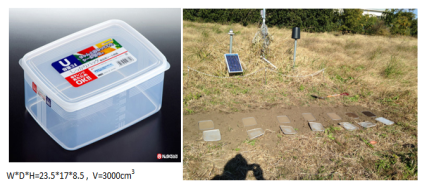
Fig. 3. selected container for main field experiment (left) and placed soil samples in the UOM research field (right)
Application to satellite imagery
A Landsat 7 image of Baghlan, Afghanistan was obtained (path165/row35, Jul. 8, 2001).
Normalized Difference Vegetation Index (NDVI) and Ts maps were computed using QGIS (ver. 2.2) image processing software. A map of relative SWC for an irrigated agricultural region of Baghlan was derived from the Ts map with the results obtained by the field experiment. The estimated SWC map was further compared with NDVI, to evaluate the adequacy of the estimated SWC map.
Calculation of NDVI
NDVI =

Where,


Reflectance of band3 and band4 has calculated. The image pixel value is not physical value, so we cannot use it without conversion. In this case the value of band3 and band4 converted to reflectance by the following equation;


Where;


d2 = Earth-Sun distance in astronomical units from an Excel file of interpolated from values listed in table 2. The table has taken from «Landsat 7 Science Data Users Handbook, page 119».
D2
=

Where, DOY is day of the year. For example; DOY for Feb. 4th is 31+4 =35


Where;
LMAX𝞴 is the spectral radiance that is scaled to QCALMAX in watts/ (squared meter *ster*µm)
The value for LMAX𝞴 is in table 4.
LMIN𝞴 is the spectral radiance that is scaled to QCALMIN in watts/ (squared meter *ster*µm)
QCALMAX is maximum quantized calibrated pixel value, which is 255. This value is in DN.
DN is pixel value in satellite sensor, minimum indicates black (water surface and dense vegetation) pixel and maximum indicates white (bare soil and deset) pixel. It shows that surface temperature is low at minimum DN and is high at maximum DN.
QCALMIN is the minimum quantized calibrated pixel value and is 1 in DN.
QCAL is the quantized calibrated pixel value in DN.
Table 2
Earth-Sun Distance in Astronomical Units
|
Day of Year |
Distance |
Day of Year |
Distance |
Day of Year |
Distance |
Day of Year |
Distance |
Day of Year |
Distance | |
|
1 |
.98331 |
74 |
.99446 |
152 |
1.01403 |
227 |
1.01281 |
305 |
.99253 | |
|
15 |
.98365 |
91 |
.99926 |
166 |
1.01577 |
242 |
1.00969 |
319 |
.98916 | |
|
32 |
.98536 |
106 |
1.00353 |
182 |
1.01667 |
258 |
1.00566 |
335 |
.98608 | |
|
46 |
.98774 |
121 |
1.00756 |
196 |
1.01646 |
274 |
1.00119 |
349 |
.98426 | |
|
60 |
.99084 |
135 |
1.01087 |
213 |
1.01497 |
288 |
.99718 |
365 |
.98333 |
(Landsat 7 Science Data Users Handbook)
Table 3
ETM+Spectal Radiance Range, watts/(meter squared*ster*µm)
|
Band Number |
Processed before July 1, 2000 |
Processed after July 1, 2000 | |||||||
|
Low gain |
High gain |
Low gain |
High gain | ||||||
|
LMIN |
LMAX |
LMIN |
LMAX |
LMIN |
LMAX |
LMIN |
LMAX | ||
|
1 |
6.2 |
297.5 |
6.2 |
194.3 |
6.2 |
293.7 |
6.2 |
191.6 | |
|
2 |
6.0 |
303.4 |
6.0 |
202.4 |
6.4 |
300.9 |
6.4 |
196.5 | |
|
3 |
4.5 |
235.5 |
4.5 |
158.6 |
5.0 |
234.4 |
5.0 |
152.9 | |
|
4 |
4.5 |
235.0 |
4.5 |
157.5 |
5.1 |
241.1 |
5.1 |
157.4 | |
|
5 |
1.0 |
47.70 |
1.0 |
31.76 |
1.0 |
47.57 |
1.0 |
31.06 | |
|
6 |
0.0 |
17.04 |
3.2 |
12.65 |
0.0 |
17.04 |
3.2 |
12.65 | |
|
7 |
0.35 |
16.60 |
0.35 |
10.932 |
0.35 |
16.54 |
0.35 |
10.80 | |
|
8 |
5.0 |
244.00 |
5.0 |
158.40 |
4.7 |
243.1 |
4.7 |
158.3 | |
(Landsat 7 Science Data Users Handbook)
According to the table, low gain and high gain can be calculated for those images, which have taken after Jul. 1. 2000.
Calculation of surface temperature
For calculation of surface temperature of an image which has taken by Landsat 7, band6 used to calculate surface temperature.

Where,
T is temperature in Kelvin
K2 and K1 are constant,
L is spectral radiance.
Band6 opened in the window of Q-GIS, and according to the image maximum and minimum value of DN observed. Maximum is white and minimum is black pixel, respectively. As well as for calculation radiance, equation 5 above has used.
Results and discussions
Results and discussions for preliminary experiment
Ts measurements of soil surfaces in the 5 types of tested containers were conducted in two clear-sky days; Mar. 16 and Apr. 11, 2013. According to the result, measured Ts tended to be the same regardless the type of containers and there was no significant difference of Ts was observed among the five containers having different size and/or materials (Figure 5). Since soil Ts was insensitive to the size and the materials of container, the shallow plastic container as shown in figure 5, left side, was selected by convenience for the main field experiment. Although, there are small number of measurement available having about 5ºC difference of surface temperature by different container. The difference of Ts from the average Ts of the five containers were plotted in figure 6. Three measurements of out of 35 measurements (i.e. 9 %) exceeded more than plus-minus 2ºC from average temperature in March 16. Five measurements out of 60 measurements (i.e. 8 %) exceeded plus-minus 2ºC from the average temperature in April 11. Viz., more than 90 % of the measurements were within plus-minus 2ºC from the average temperature. It is difficult to make a solid statistical conclusion from the limited number of the result. However, the type of container, tentatively concludes that did not affect the Ts because of the following two reasons; (1) the difference of temperature by container type shown in figure 7 is within the uncertainty of infrared radio meter, and (2) no obvious bias caused by container type was visually confirmed from figure 6.
If we accept this tentative conclusion, we can use better a shallow type container in the primary experiment. Wet soils will be evaluated in the main field experiment. If we use a deep container in the main field experiment, volumetric water content near the surface can be far from the average volumetric water content of the container because evaporation occurs only from the near-surface during the experiment. And evaporation rates related to the sequence of soil layers, hydraulic properties and water table depths as well. It makes the evaluation of result difficult. As previously described that soil water more than 10 or 15 cm depth from the bare soil surface does not immediately affects to surface heat balance, but on the other hand soil moisture up to 10 cm depth can contribute to evaporation from bare soil surface, thus a shallow container having depth within 10 cm for the main field experiment has selected.
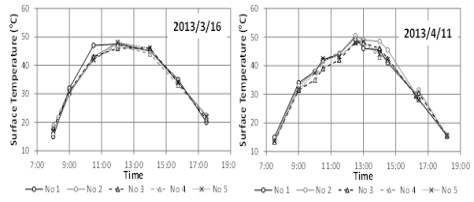
Fig. 4. Soil surface temperature of the 5 tested containers, on Mar. 16 and Apr. 1
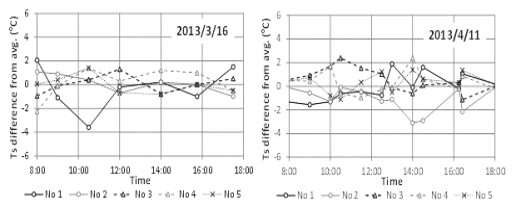
Fig. 5. Difference between soil Ts of the 5 tested containers on Mar. 16 & Apr. 11.2013
Results and Discussions for the main field experiment.
As main field experiment, SWC from zero to 60 % (=calibrated field capacity level of the soil) was examined in the first three dates of experiment (May. 8, May. 24 and Jun. 18, 2013). The trend of the results in three clear-sky dates was similar. Surface of the driest soil had the highest Ts and Ts decreased as SWC increased up to SWC = 30 %. Once SWC reached to 30 % no obvious decline of Ts was observed by further increment of SWC (Figure 6).
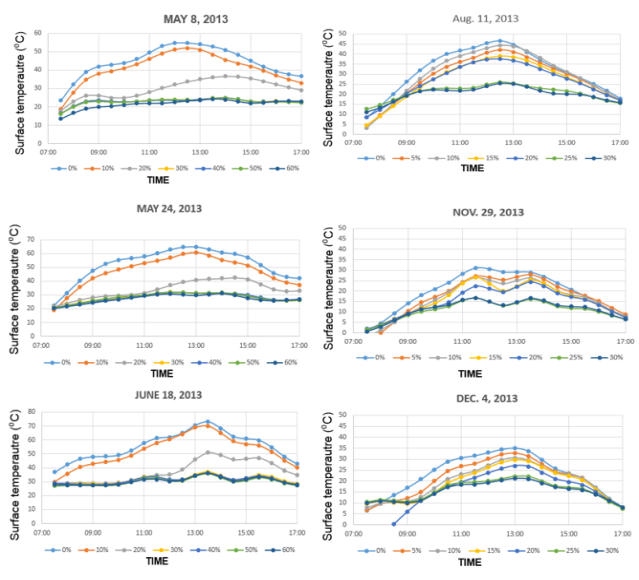
Fig. 6. Measured Ts for different levels of SWC
During the last three dates of main field experiment (Aug. 11, Nov. 29 and Dec. 4, 2013), SWC from zero to 30 % (0, 5, 10, 15, 20, 25 and 30 %) was examined in order to more closely investigate the relationship between Ts and SWC for the SWC range from zero to 30 %. The results shown in the right side of figure 8. The trend of the results in three clear-sky dates was similar. Surface of the driest soil had the highest Ts and Ts constantly decreases as SWC increases up to SWC=25 %. Ts (SWC = 25 %) and Ts (SWC = 30 %) were almost identical. Summarizing the six results of experiment, (1) Ts decreased as SWC increased for dry to moderate SWC range, and (2) decrement of Ts stopped when SWC reached to certain threshold level, which was 25 % in case of the soil investigation in this study. The threshold probably changes by the soil type and/or condition, and calibration is required for different soils.
A proportionality between SWC and ETf was tested for SWC range of zero and 25 %, with 5 % interval. Ts (dry) was assumed to be Ts (SWC=0 %), and Ts (wet) was assumed to be Ts (SWC=25 %). Ts for SWC of 5, 15 and 25 % were not measured during the first three dates of the main field experiment. For these three dates, Ts (SWC=5 %) and Ts (SWC= 15 %) were derived by linear interpolation of measured data, and Ts (SWC=25 %) was assumed to be the same with Ts (SWC=30 %). As a result, in average of the six measurements, a strong linear relationship between ETf and SWC was confirmed, as shown in figure 8. At least in bare soil condition of UOM research farm, ETf successfully described the near-surface SWC as a linear function.
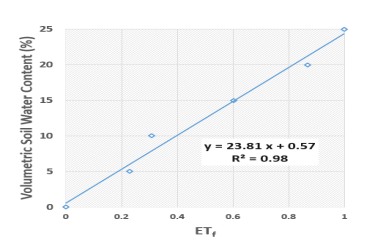
Fig. 7. Relationship between ETf and SWC by field experiment
Assuming that the trend confirmed by the field experiment is widely applicable, a relative spatial distribution of SWC for Baghlan, Afghanistan, was estimated using Landsat thermal image (Figure 8). Ts(dry) and Ts(wet), required for ETf calculation, were determined visually by finding typical wet and dry surfaces from the thermal image. NDVI image, was also derived by the Landsat red and SWC estimation result in figure 8 has not been validated because actual measurement of SWC was not conducted for the area. In this study, adequacy of estimated SWC was evaluated by comparing the results of SWC with NDVI.
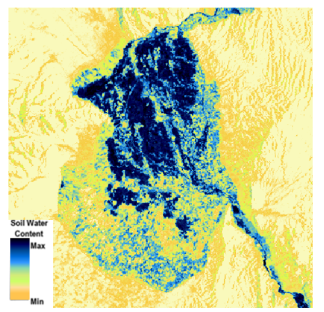
Fig. 8. Estimated SWC map of Jul. 8, 2001, Baghlan agricultural region
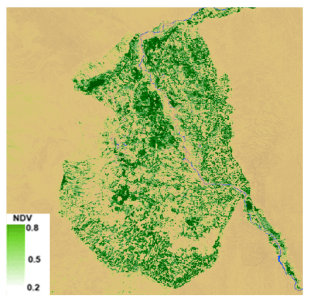
Fig. 9. Estimated NDVI map of Jul. 8, 2001, Baghlan agricultural region
Estimated SWC and NDVI took a triangle shape. Such triangle is recognized as a typical distribution pattern between evapotranspiration and surface temperature in agricultural area in the world (Kimura, 2007). Considering the strong relationship between volumetric soil water content and evapotranspiration, the result shown in figure 10 supports a successful estimation of relative SWC, with the spatial distribution, in Baghlan Afghanistan.
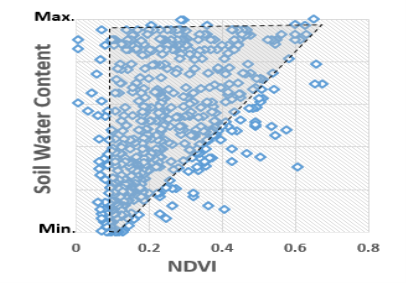
Fig.10. Distribution of NDVI and SWC in Baghlan agricultural area
As illustrated, the distribution of NDVI and SWC took triangle shape. There are some points, which are mentionable. The region having minimum NDVI is in the condition of no vegetation, most likely in bare soil condition. The figure showed that there is a wide range of soil water content for bare soil fields. The dry bare soil fields (minimum NDVI and minimum SWC) are either abandoned dry field or dry fallow field without irrigation. The wet bare soil fields (minimum NDVI and moderate to maximum SWC) should be irrigated field with no vegetation, which occurs in the beginning of cultivation (field is irrigated and wet, but crop is not yet or just after germination), just after harvest with some soil moisture remaining from the last irrigation or rainfall, irrigation for bare soil field for the purpose of salinity control, or wet field with a problem such as water logging with high-water-table. On the other hand, almost all of the fields having high NDVI (i.e. full covered by crop) have very high SWC. It would be the result of adequate irrigation so that the fields have high moisture and good amount of crop. Although the estimated result of SWC could not be validated using the actual field data, the relationship between NDVI and SWC showed a typical and reasonable relationship of NDVI and SWC for irrigated agriculture, implying that the spatial estimation of SWC was successful.
Conclusion
The relationship between surface temperature and volumetric soil water content has investigated by a field study conducted at UOM research farm. Based on the findings of this study, the following conclusions were made:
In preliminary experiment for container selection, the surface temperature of five containers having different size and/or materials, were almost the same. No significant difference of surface temperature was observed among them. Thus, a shallow plastic container (Nakaya kagaku Sangyo Co., Ltd. K233; W*D*H= 23.5*17*8.5cm, V=3000cm3) was selected by convenience for the main field experiment.
In main field experiment, different percentages of soil water contents examined in six different dates in clear-sky days. The trend of the results was similar in the first three dates of experiment and in the three dates of last experiment was as well.
Surface of the driest soil had the highest surface temperature, and surface temperature decreased as soil water content increased up to SWC=30 %. Once soil water content reached to 30 %, no obvious bias decline of surface temperature was observed by further increment of soil water content.
Comparing two results from six dates of experiment, surface temperature (SWC=25 %) and surface temperature (SWC=30 %) were almost identical.
According to the six results from the main field experiment; surface temperature decreased as soil water content increased for dry to moderate SWC range, and decrement of Ts stopped when soil water content reached to certain threshold level, which was 25 % in case of the soil investigation in this study. However, these criteria might changes by the soil type, regions and/or conditions, and calibration is required for different soils.
As a result, in average of the six measurements, a strong linear relationship between ETf and soil water content was confirmed. It is mentionable that at least in this study with bare soil conditions of UOM research farm, ETf successfully described the near-surface SWC as a linear-function.
Assuming that the relationship between Ts and SWC found in the field experiment is widely applicable; a relative spatial distribution of SWC for Baghlan Afghanistan was estimated using Landsat thermal imagery. Calculation of ETf determined visually by finding typical wet and dry surfaces from the thermal image. Furthermore, NDVI image was also derived by the Landsat red and near-infrared bands.
The adequacy of SWC and NDVI has analyzed. Soil water content and NDVI took a triangle shape in which supports a successful estimation of relative SWC, with the spatial distribution in Baghlan Afghanistan.
This study was applicable in Afghanistan.
References:
Ahmad, S., Kalra, A., Stephen, H., 2010. Estimating soil moisture using remote sensing data: a machine learning approach. Advances in Water Resources. 33, 69–80.
Breshears, D., Barnes, F., 1999. Interrelationship between plant functional types and soil moisture. Springer.
Canadell, J., Zedler, P., 1995. Woody-plant underground structures. New York. 177–210.
Charlesworth, P., 2005. Soil water monitoring, Land and Water Australia on behalf of the National Program for Sustainable Irrigation. GPO box-2182, L1 The Phoenix Building, Braddon ACT.
Daubernmire, R., 1968. Soil moisture in relation to vegetation distribution in the mountains of Northern Idaho. Ecology. 49, 431–438.
Galagedara, L.W., 2003. The GPR Direct Ground Wave Method for Soil Moisture Content Estimation:
Field Experiments and Modeling. Unpublished PhD Thesis, University of Guelph, Canada.
Ghulam, A., Qin, Q., Teyip, T., Li, Z.2007. Modified perpendicular drought Index (MPDI): a real-time drought monitoring method. ISPRS Journal of Photogrammetry and Remote Sensing. 62, 150–164.
Hawke, R.M., Price, A.G., Bryan, R.B. 2006. The effect of initial soil water content and rainfall intensity on near surface soil hydrologic conductivity: a laboratory investigation. Catena 65, 237–346.
Kimura, R., 2007. Estimation of moisture availability over the Liudaogou river basin of the Loess Plateau using indices with surface temperature. Journal of Arid Environments. 70, 237–252
Le Bissonnais, Y., Singer, M., 1992. Crusting, runoff, and erosion response to soil water content and successive rainfalls. Soil Sci. Soc. Am. J. 56, 1898–1903.
Lindroth, A., Grelle, A., Moren, A.S. 1998. Long-term measurements of boreal forest carbon balance reveal large temperature sensitivity. Global Change Biology. 4, 443–450.
Mallick, K., Bhattacharya, B.K., Patel N. K., 2009. Estimating volumetric Surface moisture content for cropped Soils using a soil wetness index based on surface temperature and NDVI. Agricultural and Forest Meteorology. 149, 1327–1342.
Njoku, E.N., Entekhabi, D., 1996. Passive microwave remote sensin of soil moisture. Journal of Hydrology. 184, 101–129.
Paloscia, S., Macelloni, G., Santi, E. 2006. Soil moisture estimates from AMSR-E brightness temperature by using a dual-frequency algorithm. IEEE Transactions on Geoscience And Remote Sensing. 44, 3135- 3144
Pierdicca, N., Pulvirenti, L., Bignami, C. 2010. Soil moisture estimation over vegetated terrains using multitemporal remote sensing data.Remote Sensing of Environment. 114, 440–448.
Rubin, Y., 2003. Soil Water Monitoring using Geophysical Techniques: Development and Applications in Agriculture and Water Resources Management. Technical Completion Reports, University of California, Berkeley.
Sano, E.E., Huete, A.R., Troufleau, D. Moran, M.S., Vidal, A. 1998. Sensitivity analysis of ERS-1 synthetic aperture radar data to the surface moisture content of rocky soils in a semiarid rangeland. Water Resources Research. 34, 1491–1498.
Stephenson, N.L., 1990. Climatic control of vegetation distribution: the role of water balance. The American Naturalist. 135, 649–670.
Tasumi, M., Kimura, R., 2013. Estimation of volumetric soil water content over the Liudaogou river basin of the Loess Plateau using the SWEST method with spatial and temporal variability. Agricultural Water Management. 118,22–28.
Truman, C., Bradford, J., Ferris, J., 1990. Antecedent water content and rainfall energy influence on soil aggregate breakdown. Soil Sci. Soc. Am. J. 54,1385–1392.
Vivoni, E.R., Gebremichael, M., Watts, C.J., Bindlish, R., Jackson, T.J. 2008.Comparison of ground-based and remotely-sensed surface soil moisture estimates over complex terrain during SMEX04. Remote Sensing of Environment. 112, 314- 325.
Wijiewardana, Y. G. N.S, Galagedara L.W 2010. Estimation of spatio-temporal variability of soil water content in agricultural fields with ground penetrating radar. Journal of hydrology. 391, 24–33.
Zhao, S., Yang, Y., Qiu, G., Qin, Q., Yao, Y., Xiong, Y., Li, C., 2010. Remote detection of bare soil moisture using a surface temperature-based soil evaporation transfer coefficient. International Journal of Applied Earth Observation and Geoinformation.12, 351–358
Zhang, Y.Q., Wegehenkel, M., 2006. Integration of MODIS data into a simple model for the spatial distributed simulation of soil water content and evapotranspiration. Remote Sensing of Environment.104, 395–408.
Zhang Z.C, Gan Z.T, Shangguan Z.P, Dong Z.B 2014. Effects of grazing on soil physical properties and soil erodibility in semiarid grassland of the Northern Loess Plateau (China), Department of Tourism and Environmental Science, Shaanxi Normal University. Catena 82, 87–91.

