The paper presents the results of studying the strength of ice for uniaxial compression and comparison with ultrasound velocity. The determination of the strength properties of ice was carried out by the destruction of samples (cores) cut out in the ice cover using a standard method using a stationary press. The ultrasonic method for determining the strength of a material belongs to physical non-destructive quality control methods. It is based on the relationship between the propagation velocity of ultrasonic vibrations in a material and its density, dynamic modulus of elasticity and, accordingly, strength.
The purpose of the article is to determine dependence between ultrasound velocity and strength of ice.
Key words: ice, strength, ultrasound, location, temperature.
Ultrasonic testing of strength and defects in some materials is one of the most effective non-destructive testing methods. In addition to strength, in a similar way you can determine the presence of voids and other defects throughout the thickness of the material.
Ultrasound is widely used to check various structural materials for defects. In particular, in addition to concrete, ultrasonic “transillumination” is used to check for hidden casting defects, critical welds and other products. At the same time, the essence of the technology is quite simple — ultrasonic waves generated by a special installation “having encountered” voids and other defects change their speed. By measuring the speed, this value is compared with special tables, and in this way, the strength and integrity of concrete or other product being tested are evaluated.
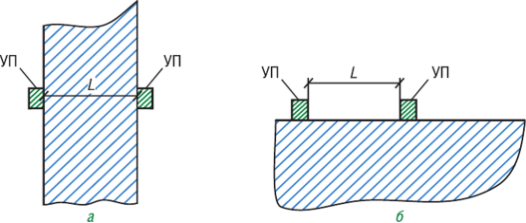
At this point in time, there are two main methods for testing concrete with ultrasound:
- End-to-end sounding — transillumination occurs through the entire thickness of the structure. In this case, the sensors for measuring the speed of ultrasonic waves are located on opposite sides of the tested reinforced concrete product;
- Surface sounding — ultrasound velocity measurement sensors are located on one side of the tested reinforced concrete product.

Fig. 1. Ultrasonic testing method for concrete: a) end-to-end sounding; b) Surface sounding
Compared to other NDT methods ultrasonic method has important advantages:
– high sensitivity to the most dangerous defects like cracks and lack of penetration
– low cost
– safety for humans (unlike x-ray radiography)
– the ability to control directly at the workplace without disturbing the process
– when conducting ultrasonic testing of the object under investigation is not damaged
– the ability to control products from a variety of materials, such as metals and nonmetals.
The disadvantages of ultrasonic inspection method include the inability to assess the real size and nature of the defect, difficulties in controlling metals with coarse-grained structure due to the large scattering and strong attenuation of ultrasound, as well as increased demands on the state of the surface control (roughness and waviness)
Location
Novik Bay is located in the Japan Sea near the coast of the Russian Island. Novik Bay is long, narrow in shape and wedges deeply into the coast of the Russian Island.
Methodology description
To determine the strength in Novik Bay, 67 samples were taken in three areas of the ice field.
- Cylindrical ice samples are made using a Kovacs Enterprise core sampler.
- Each sample was labeled in accordance with the place from where it was taken
- Temperature was measured in each sample
- Samples in plastic boxes were delivered to the laboratory
- Then were cut off the extra parts of the samples and measured the height and diameter
- Application of the ultrasonic method for determining the strength of ice. Measurements are takes two times. Sounding by end-to-end method (from top to bottom). The readings of the device are records in the test log.
- Then each sample were tested in laboratory conditions on a stationary press Shimadzu with connected laptop.
- All the data obtained were summarized in tables which are presented below.
Results of experiment
Table 1
Log of an experiment
|
№ |
Core |
Ultrasound, m/s |
Δ, mm |
F, kN |
σ ┴ , MPa |
Е, MPa |
t, C |
Diamete r , mm |
Height, mm |
|
1 |
A1 top 1 |
2895 |
5,3 |
30,34 |
4,771456 |
899,5957 |
-2,5 |
90 |
234 |
|
2 |
A1 bot 1 |
2885 |
3,7 |
24,64 |
3,874703 |
1053,452 |
-2,1 |
90 |
233 |
|
3 |
A1 top 2 |
2893 |
5,3 |
24,57 |
3,864433 |
732,0875 |
-2,5 |
90 |
233 |
|
4 |
A1 bot 2 |
2857 |
5,2 |
18,26 |
2,871479 |
557,2214 |
-1,7 |
90 |
232 |
|
5 |
A1 top 3 |
2860 |
3,8 |
33,52 |
5,272124 |
1376,915 |
-2,3 |
90 |
232 |
|
6 |
A1 bot 3 |
2902 |
3,7 |
41,70 |
6,5576 |
1794,4 |
-2,6 |
90 |
232 |
|
7 |
A1 bot 4 |
2873 |
4,8 |
20,31 |
3,193835 |
664,9141 |
-2,5 |
90 |
232 |
|
8 |
A1 top 4 |
2911 |
4,2 |
31,05 |
4,883227 |
1161,716 |
-2,6 |
90 |
230 |
|
9 |
K11 bot 1 |
2796 |
3,5 |
15,69 |
2,467956 |
699,5083 |
-1,6 |
90 |
230 |
|
10 |
K11 top 1 |
2843 |
4,6 |
19,22 |
3,022883 |
660,3208 |
-1,8 |
90 |
230 |
|
11 |
K11 top 2 |
2895 |
3,7 |
27,24 |
4,284548 |
1156,773 |
-1,7 |
90 |
234 |
|
12 |
K11 bot 2 |
2864 |
3,7 |
19,04 |
2,993662 |
813,8733 |
-1,2 |
90 |
231 |
|
13 |
K11 top 3 |
2872 |
3,7 |
27,82 |
4,375875 |
1189,475 |
-1,5 |
90 |
232 |
|
14 |
K11 bot 3 |
2830 |
4,6 |
15,09 |
2,373783 |
518,5027 |
-0,6 |
90 |
234 |
|
15 |
K11 top 4 |
2862 |
5,5 |
22,06 |
3,468633 |
630,264 |
-2,5 |
90 |
233 |
|
16 |
K11 bot 4 |
2845 |
4,9 |
21,45 |
3,373712 |
688,0213 |
-1 |
90 |
234 |
|
17 |
A11 top 1 |
2940 |
3,8 |
32,11 |
5,049792 |
1336,203 |
-2 |
90 |
234 |
|
18 |
A11 bot 1 |
2884 |
3,2 |
21,94 |
3,450798 |
1094,421 |
-1,8 |
90 |
231 |
|
19 |
A11 top 2 |
2906 |
3,4 |
23,39 |
3,678163 |
1096,944 |
-2,5 |
90 |
233 |
|
20 |
A11 bot 2 |
2893 |
5,2 |
19,83 |
3,118157 |
602,1549 |
-1,9 |
90 |
233 |
|
21 |
A11 top 3 |
2891 |
5,8 |
23,19 |
3,647338 |
633,9702 |
-2,8 |
90 |
231 |
|
22 |
A11 bot 3 |
2826 |
5,2 |
16,90 |
2,65786 |
515,7788 |
-1,5 |
90 |
233 |
|
23 |
A11 bot 4 |
2848 |
5,4 |
27,64 |
4,346434 |
804,3455 |
-1,7 |
90 |
235 |
|
24 |
A11 top 4 |
2913 |
2,6 |
31,94 |
5,023606 |
1930,055 |
-2,5 |
90 |
235 |
|
25 |
G1 (top) 1 |
2899 |
6,8 |
16,98 |
2,670441 |
392,7119 |
-1 |
90 |
235 |
|
26 |
G1 (bot) 1 |
2873 |
9,18 |
16,89 |
2,656287 |
289,3559 |
-0,9 |
90 |
231 |
|
27 |
G1 (top) 2 |
2881 |
9,55 |
12,53 |
1,970591 |
206,3446 |
-1 |
90 |
233 |
|
28 |
G1 (bot) 2 |
2848 |
5,5 |
14,70 |
2,311866 |
420,3393 |
-0,8 |
90 |
233 |
|
29 |
G1 (mid) 1 |
2892 |
4,08 |
27,22 |
4,280884 |
1049,236 |
-1,6 |
90 |
234 |
|
30 |
G1 (mid) 2 |
2872 |
10,78 |
9,81 |
1,542817 |
143,1184 |
-1,5 |
90 |
233 |
|
31 |
G5 (mid) 1 |
2921 |
6,85 |
20,25 |
3,184713 |
464,9217 |
-0,9 |
90 |
232 |
|
32 |
G5 (mid) 2 |
2865 |
6,23 |
13,76 |
2,164032 |
347,3567 |
-1,3 |
90 |
233 |
|
33 |
G5 (top) 1 |
2869 |
5,5 |
22,84 |
3,592042 |
653,0986 |
-1,2 |
90 |
237 |
|
34 |
G5 (bot) 1 |
2833 |
6,98 |
5,65 |
0,888574 |
127,3029 |
-0,5 |
90 |
230 |
|
35 |
G5 (top) 2 |
2865 |
4,93 |
13,84 |
2,176614 |
441,5039 |
-1,2 |
90 |
235 |
|
36 |
G5 (bot) 2 |
2855 |
8,05 |
20,72 |
3,25863 |
404,7988 |
-1,1 |
90 |
235 |
|
37 |
K5 (top) 1 |
2856 |
8 |
11,03 |
1,734686 |
216,8357 |
-0,9 |
90 |
237 |
|
38 |
K5 (bot) 1 |
2777 |
6,8 |
6,51 |
1,023826 |
150,5627 |
-0,5 |
90 |
233 |
|
39 |
K5 (top) 2 |
2871 |
4,23 |
20,61 |
3,241331 |
766,272 |
-1,2 |
90 |
233 |
|
40 |
K5 (bot) 2 |
2834 |
7,59 |
7,74 |
1,217268 |
160,3779 |
-0,9 |
90 |
230 |
|
41 |
K5 (top) 3 |
2930 |
8,63 |
15,04 |
2,365338 |
274,0832 |
-1,4 |
90 |
232 |
|
42 |
K5 (bot) 3 |
2813 |
7,23 |
9,73 |
1,530235 |
211,6508 |
-1,2 |
90 |
233 |
|
43 |
K1 (top) 1 |
2899 |
6,08 |
14,30 |
2,248958 |
369,8944 |
-1,2 |
90 |
234 |
|
44 |
K1 (bot) 1 |
2850 |
10 |
21,54 |
3,387591 |
338,7591 |
-1,1 |
90 |
235 |
|
45 |
K1 (top) 2 |
2894 |
5,15 |
16,70 |
2,626406 |
509,9817 |
-1,6 |
90 |
235 |
|
46 |
K1 (bot) 2 |
2873 |
6,73 |
13,04 |
2,050798 |
304,7248 |
-0,7 |
90 |
234 |
|
47 |
K1 (top) 3 |
2829 |
6,65 |
15,65 |
2,461272 |
370,1161 |
-1,2 |
90 |
233 |
|
48 |
K1 (bot) 3 |
2797 |
6,23 |
9,81 |
1,542817 |
247,6431 |
-1,1 |
90 |
233 |
|
49 |
K1 (top) 4 |
2942 |
6,9 |
18,87 |
2,967681 |
430,0987 |
-1,5 |
90 |
238 |
|
50 |
K1 (bot) 4 |
2891 |
8,35 |
16,95 |
2,665723 |
319,2483 |
-0,6 |
90 |
233 |
|
51 |
K8 bot 1 |
2866 |
4,4 |
15,47 |
2,432964 |
552,9463 |
-0,9 |
90 |
235 |
|
52 |
K8 top 1 |
2901 |
8 |
17,46 |
2,745931 |
343,2413 |
-2,2 |
90 |
237 |
|
53 |
K8 top 2 |
2869 |
4,75 |
29,38 |
4,620587 |
972,7551 |
-1,2 |
90 |
235 |
|
54 |
K8 bot 2 |
2851 |
8,93 |
13,92 |
2,189196 |
245,1507 |
-0,8 |
90 |
230 |
|
55 |
K8 top 3 |
2882 |
5,33 |
15,93 |
2,505308 |
470,039 |
-1 |
90 |
233 |
|
56 |
K8 bot 3 |
2860 |
8,3 |
13,93 |
2,190768 |
263,948 |
-0,8 |
90 |
227 |
|
57 |
D8 top 1 |
2880 |
7,35 |
19,09 |
3,00228 |
408,4735 |
-0,9 |
90 |
235 |
|
58 |
D8 bot 1 |
2867 |
7,55 |
11,69 |
1,838484 |
243,5078 |
-0,5 |
90 |
233 |
|
59 |
D8 top 2 |
2887 |
5,85 |
13,96 |
2,195486 |
375,2968 |
-0,9 |
90 |
232 |
|
60 |
D8 bot 2 |
2855 |
7,88 |
18,56 |
2,918927 |
370,4223 |
-0,4 |
90 |
230 |
|
61 |
D8 top 3 |
2834 |
5,58 |
13,28 |
2,088543 |
374,2908 |
-0,9 |
90 |
232 |
|
62 |
D8 bot 3 |
2804 |
5,85 |
19,89 |
3,128096 |
534,7173 |
-0,4 |
90 |
233 |
|
63 |
D1 mid |
2812 |
6,13 |
12,67 |
1,992608 |
325,0585 |
-0,8 |
90 |
234 |
|
64 |
D1 top 2 |
2860 |
7,78 |
19,80 |
3,113942 |
400,2496 |
-0,8 |
90 |
233 |
|
65 |
D1 bot 2 |
2843 |
7,13 |
16,60 |
2,610679 |
366,1541 |
-0,7 |
90 |
232 |
|
66 |
D1 top 3 |
2826 |
9,43 |
12,58 |
1,978454 |
209,8042 |
-1 |
90 |
230 |
|
67 |
D1 bot 3 |
2794 |
4,58 |
10,93 |
1,718959 |
375,3185 |
-0,7 |
90 |
226 |
The press test was carried out with constant loading rates — 2.5 mm/s. Also all samples have diameter 90 mm.

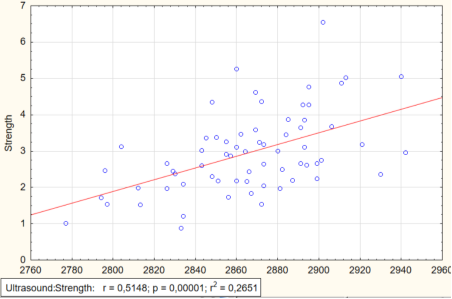
Fig. 2. Correlation between strength and ultrasound velocity

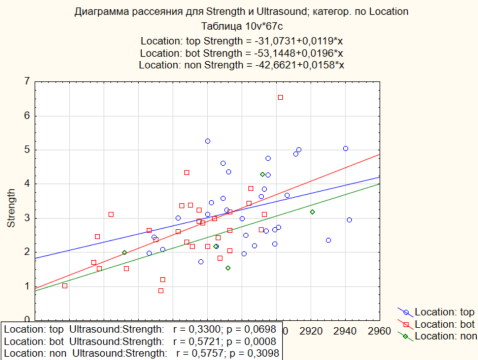
Fig. 3. Correlation between strength and ultrasound velocity taking into account the location of the sample in the core

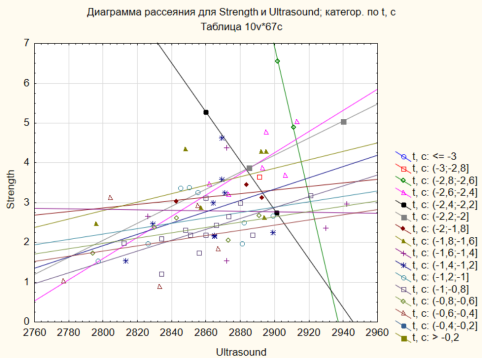
Fig. 4. Correlation between strength and ultrasound velocity taking into account the temperature of the sample
Conclusion
Based on the results obtained, it is obvious that there is a relationship between the strength of ice and the speed of ultrasound through it. In this work, the location of the sample in the core and the temperature of the samples were also taken into account. The correlation coefficient shows that the relationship is not strong enough, therefore, this method should be studied in more depth.
References:
- SP 38.13330.2012 Loads and impacts on hydraulic structures (wave, ice and from ships). Updated edition of SNiP 2.06.04–82 *.
- ISO 19906.2010 Petroleum and natural gas industries — Arctic offshore structures.
- Bekker A. T. Program of Experimental Study of the Three-Dimensional Ice Strength Distribution for Ice Force Analysis / Proc. Offshore and Polar Engineering Conference. Los Angeles, 1996.
- Proceedings of the Third International Scientific Conference
- CAN/CSA-S471–04. General requirements, design criteria, the environmental and loads, National Standard of Canada, app. Dec. 2005.
- API RP 2N. Recommended practice for planning, designing and construction structures and pipelines for Arctic conditions / Amer. Petroleum Inst. Bulletin. Dallas, 1995.
- Stepanyuk I. A. Sea ice testing and modeling technologies / Hydrometeizdat. Saint-Petersburg, 2001

