The paper presents the results of studying the strength of ice for uniaxial compression in the Novik Bay on the Russian island. The determination of the strength properties of ice was carried out by the destruction of samples (cores) cut out in the ice cover using a standard method using a stationary press. In parallel, measurements of temperature, density and salinity of the samples were carried out. The purpose of the article is to determine affecting rate of application load on ice strength.
Keywords: ice, strength, destruction, salinity, temperature, density, rate, load.
Nowadays oil and gas production is actively developing in the Arctic conditions, since this area has not yet been developed, and of course, the ice has a significant impact on platforms and structures. Thus, the development of studies of the properties of ice occurs in parallel with the development of oil production activities in the zone of freezing seas. Since the strength of ice is one of the most important parameters of ice, this study is very relevant.
Location
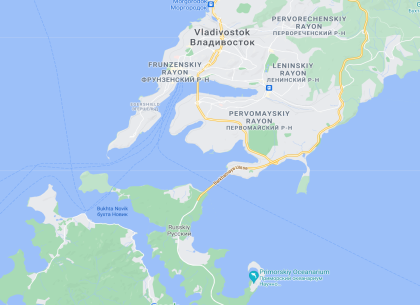
Novik Bay is located in the Japan Sea near the coast of the Russian Island. Novik Bay is long, narrow in shape and wedges deeply into the coast of the Russian Island between Cape Staritsky and Cape Elagin. It separates the Saperny peninsula from the main part of the Russian island.


Fig. 1. Location of experiments
Ice strength
Various literature sources provide data on ice strength, the large scatter of these data is explained by the fact that ice strength depends not only on temperature, but also on a number of other factors: the presence of impurities, structure, load application rate, etc. In addition, ice constantly the recrystallization process occurs by moving the boundary between crystals, changing the shape and size of the crystals. The porosity of ice, both hardness and strength, depends on the density of the ice, the higher the density of the ice, the less porosity. Table 1 presents data on ice porosity.
Table 1
Dependence of ice porosity on density
|
Denstity , g/sm 3 |
0,1 |
0,2 |
0,3 |
0,4 |
0,5 |
0,6 |
0,7 |
0,8 |
0,9 |
|
Porosity, % |
89 |
78 |
67 |
56 |
46 |
35 |
24 |
13 |
2 |
Based on observations, it was determined that the density and porosity of ice are related by the relationship:

where q is porosity; ρ 0 is the density of monolithic ice; ρ is the density of the studied ice.
The main feature of ice is that under normal conditions it is at temperatures close to the melting point, therefore it contains a certain amount of a liquid phase, which acts as a lubricant when the crystals slide relative to each other. In addition, ice does not enter into chemical reactions with other substances, and does not form hard, indestructible materials.
Methodology description
To determine the strength in Novik Bay, 42 samples were taken in three areas of the ice field.
- Cylindrical ice samples are made using a Kovacs Enterprise core sampler.
- Each sample was labeled in accordance with the place from where it was taken
- Temperature was measured in each sample
- Samples in plastic boxes were delivered to the laboratory
- The salinity of each sample was determined with refractometer Kelilong RHS-10BATC
- The density was determined for each sample. In the method of determination ice density, the ice sample, without being removed from the liquid, is transferred and placed with it into the vessel, after which the ice sample is forcedly heated in the vessel until it is completely immersed in the liquid and in this state the liquid level in the vessel is noted, then the vessel is weighed with all its contents and the ice sample is quickly removed from the vessel, after which the vessel is re-weighed with the liquid remaining in it and the weight of the selected ice sample is judged by the difference between the results of weighing the vessel with and without the ice, then into the vessel with all contents and with the liquid remaining after removal from it an ice sample, add liquid to its previously noted level and judge by the volume of liquid added to the vessel the volume of the ice sample, and its density is calculated by weighing and determining the volume of the ice sample.
- Then were cut off the extra parts of the samples and measured the height and diameter
- Each sample were tested in laboratory conditions on a stationary press Shimadzu with connected laptop.
- All the data obtained were summarized in tables which are presented below.
Results of experiment
The press test was carried out with different loading rates — 0.5, 1, 1.5 mm / s and samples divided into 3 groups according area it were taken.
Table 2
Parameters of the 1 group of samples
|
№ |
Average ice temperature, °C |
Diameter of ice sample, m |
Area of ice sample surface, m 2 |
Destruction rate , mm/sec |
Load, kN |
Displacement, mm |
Ice strength, kN/m 2 |
|
1 |
-1,8 |
0,0890 |
0,007915 |
0,5 |
21,83 |
2,6 |
2758,03 |
|
2 |
-1,8 |
0,0877 |
0,007685 |
0,5 |
23,472 |
2,6 |
3054,08 |
|
3 |
-1,9 |
0,0890 |
0,007921 |
0,5 |
27,88 |
2,04 |
3519,76 |
|
4 |
-1,8 |
0,0887 |
0,007862 |
0,5 |
14,33 |
2,62 |
1822,74 |
|
5 |
-1,7 |
0,0887 |
0,007862 |
0,5 |
31,07 |
6,92 |
3952,03 |
|
6 |
-1,9 |
0,0880 |
0,007744 |
0,5 |
26,96 |
7,47 |
3481,40 |
|
7 |
-1,8 |
0,0870 |
0,007569 |
0,5 |
24,03 |
4,26 |
3174,79 |
|
8 |
-1,7 |
0,0877 |
0,007685 |
0,5 |
13,662 |
1,31 |
1777,65 |
|
9 |
-1,8 |
0,0880 |
0,007744 |
0,5 |
14,99 |
2,67 |
1935,69 |
|
10 |
-1,7 |
0,0863 |
0,007453 |
0,5 |
20,247 |
4,62 |
2716,46 |
|
11 |
-1,6 |
0,0880 |
0,007744 |
0,5 |
20,48 |
2,6 |
2644,63 |
|
12 |
-1,8 |
0,0900 |
0,008100 |
0,5 |
31,88 |
4,32 |
3935,80 |
|
13 |
-1,9 |
0,0893 |
0,007980 |
0,5 |
16 |
- |
2004,90 |
|
14 |
-1,8 |
0,0887 |
0,007862 |
0,5 |
29,9 |
1,44 |
3803,21 |
Table 3
Parameters of the 2 group of samples
|
№ |
Average ice temperature, °C |
Diameter of ice sample, m |
Area of ice sample surface, m 2 |
Destruction rate , mm/sec |
Load, kN |
Displacement, mm |
Ice strength, kN/m 2 |
|
1 |
-1,5 |
0,088 |
0,006079 |
1,5 |
21,2 |
2,69 |
3487,393 |
|
2 |
-1,5 |
0,09 |
0,006359 |
1,5 |
21,53 |
1,15 |
3386,019 |
|
3 |
-1,2 |
0,088 |
0,006079 |
1,5 |
18,28 |
2,28 |
3007,054 |
|
4 |
-1,2 |
0,089 |
0,006218 |
1,5 |
32,44 |
3,61 |
5217,124 |
|
5 |
-0,9 |
0,088 |
0,006079 |
1,5 |
20,17 |
1,56 |
3317,958 |
|
6 |
-1,4 |
0,089 |
0,006218 |
1,5 |
27,83 |
0,84 |
4475,726 |
|
7 |
-1,5 |
0,089 |
0,006218 |
1,5 |
33,18 |
1,13 |
5336,134 |
|
8 |
-1,7 |
0,089 |
0,006218 |
1,5 |
27,28 |
1,57 |
4387,273 |
|
9 |
-1,5 |
0,088 |
0,006079 |
1,5 |
21,49 |
1,58 |
3535,098 |
|
10 |
-1,7 |
0,089 |
0,006218 |
1,5 |
20,91 |
0,97 |
3362,826 |
|
11 |
-1,6 |
0,089 |
0,006218 |
1,5 |
27,56 |
1,4 |
4432,304 |
|
12 |
-1,4 |
0,089 |
0,006218 |
1,5 |
26,84 |
1,2 |
4316,511 |
Table 4
Parameters of the 3 group of samples
|
№ |
Average ice temperature, °C |
Diameter of ice sample, m |
Area of ice sample surface, m 2 |
Velocity, mm/sec |
Load, kN |
Displacement, mm |
Ice strength, kN/m 2 |
|
1 |
-1,8 |
0,087 |
0,00594 |
2,5 |
18,50 |
1,56 |
3113,61 |
|
2 |
-1,8 |
0,088 |
0,00608 |
2,5 |
13,73 |
1,91 |
2258,58 |
|
3 |
-1,9 |
0,089 |
0,00622 |
2,5 |
14,00 |
6,24 |
2251,53 |
|
4 |
-1,8 |
0,089 |
0,00622 |
2,5 |
14,57 |
5,24 |
2343,20 |
|
5 |
-1,7 |
0,089 |
0,00622 |
2,5 |
31,00 |
3,33 |
4985,54 |
|
6 |
-1,9 |
0,0895 |
0,00629 |
2,5 |
20,75 |
4,78 |
3299,91 |
|
7 |
-1,8 |
0,089 |
0,00622 |
2,5 |
12,79 |
4,36 |
2056,94 |
|
8 |
-1,7 |
0,0885 |
0,00615 |
2,5 |
9,15 |
5,88 |
1488,21 |
|
9 |
-1,8 |
0,087 |
0,00594 |
2,5 |
28,00 |
3,71 |
4712,48 |
|
10 |
-1,7 |
0,089 |
0,00622 |
2,5 |
13,60 |
3,22 |
2187,20 |
|
11 |
-1,6 |
0,089 |
0,00622 |
2,5 |
16,01 |
6,24 |
2574,79 |
|
12 |
-1,8 |
0,087 |
0,00594 |
2,5 |
22,20 |
5,50 |
3736,33 |
|
13 |
-1,9 |
0,089 |
0,00622 |
2,5 |
24,15 |
3,80 |
3883,89 |
|
14 |
-1,8 |
0,088 |
0,00608 |
2,5 |
14,10 |
4,60 |
2319,45 |
|
15 |
-1,8 |
0,088 |
0,00608 |
2,5 |
29,01 |
5,26 |
4772,14 |
|
16 |
-1,7 |
0,089 |
0,00622 |
2,5 |
17,85 |
5,63 |
2870,70 |
According all results were determined average, minimal, maximum and standard deviation values in table 5.
Table 5
General values for three groups of samples
|
GROUP1 |
GROUP2 |
GROUP3 | |
|
RATE |
0,5 |
1,5 |
2,5 |
|
AVG |
2898,66 |
4021,784955 |
3053,41 |
|
MIN |
1777,65 |
3007,053745 |
1488,21 |
|
MAX |
3952,03 |
5336,13 |
4985,54 |
|
STD |
788,7242 |
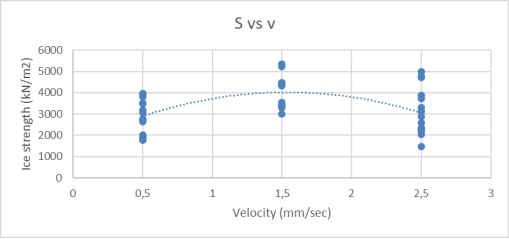
It also shows a graph of the dependence of ice strength on the rate of destruction of samples.

Fig. 2. Dependence of ice strength on the rate of destruction of samples
Conclusion
The tests carried out give a clear understanding that the rate of ice destruction under the same conditions gives different ice strength for uniaxial compression. Proceeding from this, it is necessary to correctly control the factors of conducting experiments to test the strength of ice.
References:
- SP 38.13330.2012 Loads and impacts on hydraulic structures (wave, ice and from ships). Updated edition of SNiP 2.06.04–82 *.
- ISO 19906.2010 Petroleum and natural gas industries — Arctic offshore structures.
- Bekker A. T. Program of Experimental Study of the Three-Dimensional Ice Strength Distribution for Ice Force Analysis / Proc. Offshore and Polar Engineering Conference. Los Angeles, 1996.
- Proceedings of the Third International Scientific Conference
- CAN/CSA-S471–04. General requirements, design criteria, the environmental and loads, National Standard of Canada, app. Dec. 2005.
- API RP 2N. Recommended practice for planning, designing and construction structures and pipelines for Arctic conditions / Amer. Petroleum Inst. Bulletin. Dallas, 1995.

