


Outward Foreign Direct Investment became one of the driving force of countries’ economic development. It brings new technologies, know-how, resources, boosts competitiveness, increases managerial skills, helps to get access to new distribution channels to investing countries. There are ways to measure Outward Foreign Direct Investment Performance in order to estimate foreign investment situations in various countries. The article analyzes the Outward Foreign Direct Investment Performance of China and Russia by the UNCTAD method and compares the analysis results.
Keywords: OFDI Performance, China, Russia.
Since 2002, The United Nations Conference on Trade and Development (UNCTAD) has adopted FDI inflow performance index in its Annual World Investment Report and Inward FDI Potential Index, which refers to objective to describe and evaluate the current situation and prospect of attracting FDI from various countries, and to objectify and reflect the ranking and status of the above performance potential of an economy in the world through the ranking of index size. Although the purpose of designing performance index and potential index is to measure the situation of foreign investment in various countries, it can be concluded that the scope of application can be extended by observing the composition characteristics and value sources of the index, that is to say, calculating the value range of variables through appropriate changes, transforming it from a national index to an index system describing and evaluating the actual situation of domestic components in attracting FDI.
The performance index UNCDAT defines as the ratio of a country’s FDI inflow (outflow) to the global FDI inflow (outflow) and its GDP to the global GDP over a period (Formula 1). If the index value is greater than 1, it means that the scale of FDI attracted (invested) by the country in the world is larger than that of GDP, that is the performance is outstanding; on the contrary, if the index value is less than 1, it means that the scale of FDI attracted (invested) by the country in the world is smaller than that of GDP, that is, the performance is low; if the index value is equal to 1, it means that the scale of FDI attracted (invested) by the country in the world is equal to that of GDP, that is the performance is normal. The mathematical expression of the performance index is:
![]() (Formula 1);
(Formula 1);
Where INDi is the performance index of the contry i, FDIi is the flow of the foreign direct investment of the country i, FDIw is the global flow of the foreign direct investment, GDPi is GDP of the country i, GDPw is the global GDP. [3]
This index has its advantages and disadvantages. One of the advantages is the fact that investment flows are considered based on one of two main directions. The first is where foreign investment is seen as one of the guiding principles of the policy; in the second direction, investment flows are considered proceeding from the guidance of international investment policy. The main disadvantage of this technique is the fact that it is more based on value judgments and recommendations are difficult to implement in real conditions. There are also areas for improvement for this approach to assess investment flows. So, the possible ways could be: integration of strategic recommendations into the real economy, inclusion of sustainable development goals in investment policy along with ensuring the relevance and effectiveness of investment policy. [4]
For the purposes of the analysis, statistics were collected data [1] on the Gross Domestic Product and Outward Foreign Direct Investment of Russia, China and the global data from 2007 to 2018 in order to identify the general picture. Dynamics can be observed on Picture 1 (GDP) and Picture 2 (OFDI).
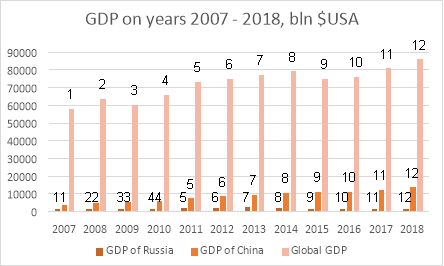
Fig. 1. Russia’s, China’s, Global GDP, 2007–2018
As we can see from the graph, in the considered period, the maximum GDP indicators in the world and in Russia were registered in 2017, and in China the maximum was reached in 2013. The minimum global indicator was reached in 2007, as well as in China, the minimum indicator for Russia was registered in 2009.
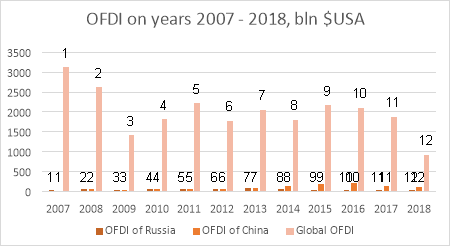
Fig. 2. Russia’s, China’s, Global OFDI flows, 2007–2018
According to this graph, the maximum FDI at the world level was achieved in 2007, according to this indicator, Russia was in the lead in 2013, China in 2016. The minimum marks were registered in 2009 at the global level, as well as for Russia, and the minimum indicator for China was reached in 2007.
Further, using Formula 1 and the obtained data on GDP and OFDI for the calculations, we obtain the following results (Table 1):
Table 1
Russia’s and China’s INDi Analysis results
|
Share of RU GDP in Global GDP (%) |
Share of CN GDP in Global GDP (%) |
Share of RU OFDI in Global OFDI (%) |
Share of CN OFDI in Global OFDI (%) |
IND CN |
IND RU |
|
|
2007 |
2.24 |
6.12 |
1.44 |
0.55 |
0.09 |
0.63 |
|
2008 |
2.61 |
7.22 |
2.12 |
2.16 |
0.3 |
0.82 |
|
2009 |
2.03 |
8.46 |
3.07 |
3.11 |
0.4 |
1.66 |
|
2010 |
2.31 |
9.22 |
2.89 |
3.18 |
0.36 |
1.3 |
|
2011 |
2.80 |
10.29 |
3.01 |
2.18 |
0.22 |
1.12 |
|
2012 |
2.94 |
11.36 |
2.74 |
3.65 |
0.32 |
0.94 |
|
2013 |
2.97 |
12.39 |
4.21 |
3.55 |
0.3 |
1.5 |
|
2014 |
2.60 |
13.16 |
3.17 |
6.83 |
0.53 |
1.26 |
|
2015 |
1.82 |
14.68 |
1.02 |
8.07 |
0.58 |
0.6 |
|
2016 |
1.68 |
14.62 |
1.06 |
10.29 |
0.72 |
0.65 |
|
2017 |
1.95 |
15.00 |
1.95 |
7.37 |
0.35 |
0.99 |
|
2018 |
1.93 |
15.84 |
3.41 |
10.48 |
0.66 |
1.77 |
According to the decoding of the index value, and applying its results, we see that the smallest result for China was in 2007 (~0.09 < 1); the best OFDI performance in China was in 2016 (~0.72 < 1), both of them are indicators of low OFDI efficiency. On average, for the considered period of 2007–2018, the index value for China fluctuates at the level of 0.38.
As for Russia, the maximum value of the index belongs to 2018 (~1.77 > 1) and shows that the effectiveness of Russian OFDI in 2009 was outstanding. The lowest result for Russia belongs to 2015 (0.6 < 1), which means, as we established before, this is an indicator of low performance. On average, the index value for Russia is at the level of 1.04, which is slightly more than 1, and suggests that for the observation period the performance of Russian OFDI in general is normal.
For better visual representation, we have put results of the analysis into Figure 4–3, to see fluctuation of the index through the years.
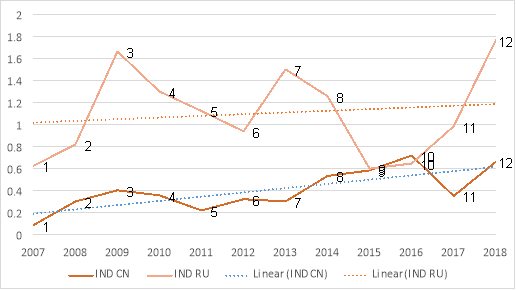
Fig. 3. INDi value of Russia and China fluctuation; trend, 2007–2018
From this graph we can observe that the values of the index of China and Russia were as close as possible in 2015 (0.02 difference). The maximum difference was observed in 2009 (1.26 difference).
The graph above shows the trends of the IND index for Russia and China. Both trends are increasing, but the Chinese IND trend is stronger, since its angle to the axis is larger than the angle of the Russian trend. Based on the GDP trends of Russia and China, it is possible to identify a full-fledged economic cycle with the beginning in 2009 and a depression point in 2016.
According to the prevailing trend, the IND cycle coincides with the economic cycle 2009–2016, China has the lowest point in 2017, after which followed by an increase in the indicator, from which we can conclude that the effectiveness of outgoing foreign investment is as cyclical as the economy itself. The curve of China's IND shows a stable, steady growth rate, with downturns corresponding to the course of the economic cycle, which tells us about the stability of the country's economic situation and its development.
The minimum value of IND of China (~0.09) in 2007, according to UNCTAD experts, might be explained by weak economic growth in the world. This is also explained by the end of the economic cycle of 2002–2008 in China and the increased inflation in the second half of 2007.
The maximum value of IND of China (~0.72) in 2016 can be interpreted by the situation in China in 2016, when GDP growth slowed to 6.9 %, which means that the value of GDP approached the value of FDI and gave the index value close to normal. It is also impossible not to exclude the phenomenon of round-tripping, which implies the process of capital transfer to a foreign company with the subsequent return of this capital to the «parent” company under the guise of foreign investment (which is quite common for other countries as well).
The Russian IND indices curve reflects sharp periods of growth and decline. On the one hand, this characterizes the Russian economy as a young economy, so the economy of the post-Soviet space is unstable. On the other hand, the events of 2008 (World Economic Crisis) and 2014 (Annexation of Crimea), which are characterized by a decline in the indicator, found their reflection on the curve. After 2016, an increase in the indicator is observed for Russia, as well as the beginning of a new economic cycle. For China, this event marked the year 2017.
As for Russia, its maximum value of the index of 2009 (~1.66), its significance was due to the unexpectedly confident exit of Russia from the 2008 World Economic Crisis. This was facilitated by a decrease in inflation (by 4.8 % compared to the crisis year of 2008). But if you look at the years coming after 2009 (2010, 2011, 2012), the value of the index fell noticeably, which is not surprising — the consequences of the crisis affected the country's economy. And if by 2013 the index managed to increase to 1.3, then the events in the international arena of 2014 (the annexation of Crimea) again worsened performance, and the index value fell to the minimum value of 0.6 in 2015 for the observation period. But in subsequent years, there is still an increase in the index.
References:
- United Nations Conference on Trade and Development Statistics URL: https://unctad.org/en/Pages/statistics.aspx
- Общество и государство в Китае: XLI научная конференция / Ин-т востоковедения РАН. — М.: Вост. лит., 2011. — 440 с. — (Ученые записки Отдела Китая ИВ РАН. Вып. 3 / редкол. А. А. Бокщанин (пред.) и др.). — ISBN 978–5-02–036461–5 (в обл.). С. 228–243.
- “中国各地区外国直接投资流入业绩指数与潜力指数比较”, 邢厚媛(研究员), 冯赫(博士) (DOI: 10. 14114/j/cnki.itrade.2003.11.011)
- Челышева Д. А., Новак М. А. Методика оценки прямых иностранных инвестиций // Инновационная экономика: перспективы развития и совершенствования. — 2018. — № 5. — С. 169.
