


The need for the fault tolerant logging infrastructure cannot be overestimated. Event logs gathered from different sources which include network devices, mission – critical servers as well as the other systems are the start point of the each audit trail in case something goes wrong. Several industry standards for banking and health industry (HIPAA) require fault – tolerant logging and event analysis infrastructure. [1]
This kind of infrastructure has several industry standards and limitations it has to comply with – for instance all logs which include customer – related sensitive information have to be gathered and stored for several years. Some ISP's (Internet Service Providers) also have different directives in saving customer – related access logs.
The logs gathered from different devices are often used in the IPS (intrusion Prevention) systems for immediate report and automatic prevention of threats. Logs are also used in the forensics investigations which are often conducted in the companies after security incidents have happened. The main problems facing the fault – tolerant logging infrastructure come with the solution architecture. The necessary adjustments and improvements can produce resilient and fault-tolerant solution.
Typically, logging can be solved by the use of most common log standard – syslog. [2] Most network devices as well as the servers and workstations support this standard and have different implementations of the syslog protocol.
Due to the criticality of logging systems they have to provide known level of reliability and redundancy. The logging infrastructure comes as the complex system and due to this the MTTF (Mean Time to Failure) and MTTR (Mean Time to Repair) values is hard to calculate.
However, different approach can be used – instead of calculating the MTTF value designer can follow different guidelines and best practices to ensure that the system is highly – available, redundant and reliable.
Most common technique is the clustering of the critical points (devices). The idea of this technique is to avoid the “single points of failure” - e.g. single nodes which are not coupled with other nodes performing the same task. Clustering helps to avoid the situations where the process cannot be executed due to an unresponsive device – the request in this case can be forwarded to the similar device in the cluster and successfully served.
Before the design phase it is necessary to understand the logging process and to write down the most critical parts of it.
Typical logging solution can be described as follows: the log server resides in the server rack being connected to the local area network. Networking devices send their system and/or traffic logs directly to this server using an unreliable transport protocol UDP (User Datagram Protocol). [2], [3] Server has syslog software running as a daemon and usually no software fault – tolerance is applied – e.g. software watchdogs, CPU usage thresholds etc. No hard disk drive redundancy is used as well. This solution design is very basic and does not provide any level of availability and reliability in the infrastructure.
This type of solution can be described as the “client – server” solution and it has a lot of weak points as well as the single points of failure (SPOF). Figure 1 describes the logic of the logging infrastructure as a client – server model, where logs are sent across the network.

Figure 1. Basic network logging system
In the logging infrastructure the most vulnerable points come from the logging requirements. The logging critical aspects are:
Logging information guaranteed arrival to the recipient (Logging server)
Right chronological order of messages
Reliable storage of logged data for a specified period of time
As for the typical logging solution, none of the aspects can be fulfilled, because:
there is no synchronization within the messages (for instance, if several messages arrive within the same second, most likely they will have the same timestamp)
Unreliable transport protocol is used – there is no checking performed if the packet is arrived to the destination
The storage solution with the single hard disk drive is unreliable – if the hard disk drive will fail and will be unreadable then most likely the information on it will be lost. During the remediation time the infrastructure will be inoperable
Also there are several aspects as well regarding the availability of this solution but they are mostly related to the location – e.g. uninterruptable power supply, access network layer redundancy etc. There are common to all similar solutions.
According to the problems typical logging infrastructure has, the proposed solution has to eliminate them and add necessary redundancy at the all layers.
Logging solution can be enhanced by multiplying server nodes (blades) and using the load balancer in front of them (see Figure 2). The load balancer itself should be able to monitor network services availability in service pool it is responsible for and react if something changes. Also load balancer knows what is the maximum performance e.g. how many packets per second it can send to each server in pool. The load balancer main idea is that this device should receive syslog messages and forward them to the syslog servers based on the intelligent load balancing algorithm it runs.
Different techniques can be applied to the load balancer – it can send ICMP (Internet Control Message Protocol) and/or SNMP (Simple Network Management Protocol) queries to the syslog servers, it can passively receive SNMP traps from them or it can monitor syslog network ports to ensure that the service is available and the syslog message could be sent there. It can monitor servers' load as well and make packet sending decisions based on that. In case one or more nodes should fail, the load balancer will be aware of that and it will forward the traffic to another node.
The most appropriate way to make sure that the necessary services are running is to perform a service checks. As it will be seen further, the TCP/IP (Transmission Control Protocol) is used as the transport protocol for the syslog messages – therefore the 514 TCP port (syslog RFC standard port) can be monitored by the load balancer to ensure that the service is available. ICMP does not provide any availability information about the service – it can only show that the host is up and running. SNMP daemon on the server blade can become unresponsive and do not produce any information but it does not necessarily mean that the syslog process is offline.
The load balancer should not become a SPOF (that would be a design mistake), therefore it has to be clustered. As for many systems, the complexity and network congestion grow as fast as the number of devices in the cluster, therefore the best practice is to use two load balancers in a single cluster.
During the clustering, it is necessary to avoid session synchronization problem as well as the so-called “split brain” and “no-brain” problems. Those problems are very common in clustering. The session synchronization is a problem in case the cluster performs in the active/active mode – both load balancers share a single VIP (Virtual IP) and work simultaneously. If there are many network packets, they are most likely sent within a single TCP session (in UDP, per-packet load-balancing forwarding approach can be used). The complexity of the ARP (Address Resolution Protocol) configuration in the system's kernel might lead to the situation where the packet is sent to the other load balancer in cluster within a single session.
“Split-brain” and “no-brain” problems occur in the active/passive setup, while only one load balancer should operate and the other is hot-standby. The problems take place in case the synchronization network between two load balancers does not perform well and so-called “heartbeat” messages do not reach the other node. In this case, the standby node performs the failover operation and starts its load balancing daemon, as well this node takes the ownership of the shared VIP address, thus causing the network errors – the same IP address now belongs to both nodes simultaneously.
The “no-brain” problem is the opposite of the “split-brain” - in this case the master node becomes standby and in this situation the traffic does not flow through the load balancer.
To avoid both problems, the designer should consider that the synchronization network should be available all the time. A good solution is to use aggregated (e.g. coupled) interfaces in load balancers according to the IEEE 803.2ad standard – in this case the interface failure/cable removal would not cause problems as far as the second cable is inserted. [4] The other way to add reliability to the synchronization is to build two separated synchronization networks between balancers.
The active/passive setup is the recommended one because in the active/active deployment in case if the one load balancer fails then the other one should be able to handle all traffic load coming from the clients' side. In this case, the less complex setup can be used which can help avoid some problems in the future (e.g. session synchronization, software upgrades etc).
While the setup is active/passive, it is necessary to avoid “split-brain” and “no-brain” problem. In the load balancers, usually the heartbeat daemon which is aware of the node state (whether it is active or passive) starts the load balancing daemon as well. This approach is straight – forward and quite simple but also it helps to minimize the delays in failover situations.
Figure 2 shows the high – available setup solution using two load balancers. This kind of solution is also referred as the “sandwich” because the load balancers reside between access – layer switches.
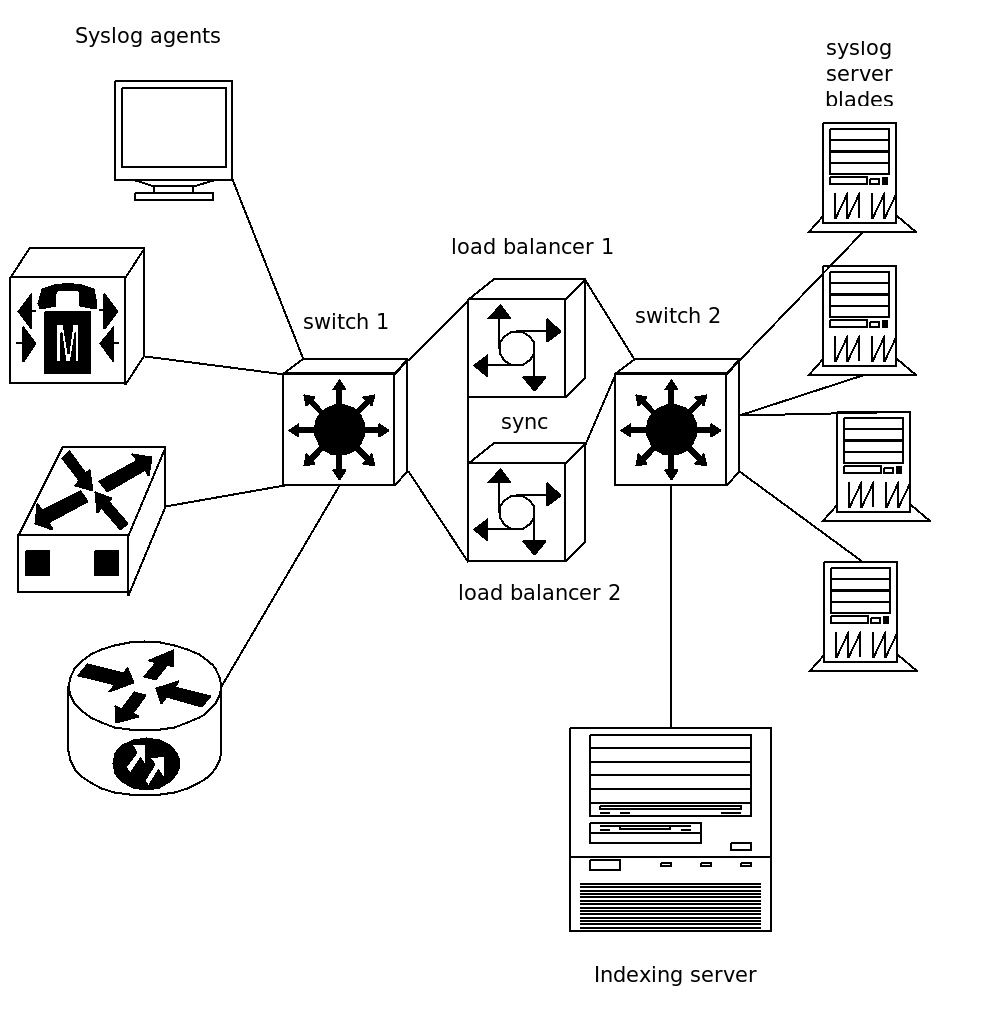
Figure 2. Resilient logging infrastructure
The syslog software daemon should be monitored from the syslog server host as well. In case the process hangs or starts to consume machine resources above the specified threshold, it should be restarted automatically and the message about this alert will be directed to the system administrator.
In some scenarios, the machine itself should be restarted, which requires custom scripting activation from the software watchdog as the built – in feature.
The software distribution for the nodes as well as the load balancer should be a stable release, while preparing the environment the “keep it simple” approach also has to be considered. In other case it would be complicated to predict the solution behavior in some stress situations.
The requirement to receive and save all log files involves the redundant hard disk drives arrays as well as the reliable networking protocol. The UDP protocol cannot be used because it does not provide reliability – there are no extra checks performed on the packets which should reach the destination. In this case, the sender is not aware about the status of the data sent – if the packet should be dropped by some networking device in the data path, the sender does not transmit it again.
Instead of the UDP protocol, the TCP protocol can be used. The TCP stands for the Transmission Control Protocol and within this protocol different checks are performed to ensure that packets successfully reached their destination, they are not modified and are in the correct order.
TCP also performs cyclic redundancy checks both in the control and the data part of the network packet thus ensuring that each packet's integrity persisted.
To ensure the storage availability, the RAID (Redundant Array of Independent Disks) technology for mirroring the disks can be used. [6] There are several ways to ensure this kind of redundancy – the most reliable way is to use the RAID1 setup also referred as the “mirror” RAID.
In the mirroring setup each portion of information is written simultaneously to all participating disk partitions. In case of disk failure in the array it should be replaced – RAID automatically takes care of the new disks and synchronizes information between them.
It is also a good practice to build arrays based on the different hardware disk controllers – in this case, the controller failure does not cause the storage failure – other disks are bound to different controllers which continue to operate.
Nevertheless, bit flapping on disks and similar kind of problems might happen cannot be solved using RAID – several other techniques can be used to prevent reliability of information stored on disks – for example verification of file hashes.
Figure 2 shows that in the proposed setup the indexing server which parses the logs and provides GUI frontend for forensics is the actual SPOF in this system. If the server hangs and all the information on it will be lost, then the GUI will not be available.
However, those logs are stored in the syslog server blades and they can be synchronized to the new indexing server in case if failure. If it is considered that the GUI availability is also a critical aspect, then the server has also to be clustered. The proposal is to use two different machines with redundant network file storage system for storing the logs. In this case, different indexers run simultaneously while reading and parsing the same log files and in case of failure of one instance the other will continue to operate.
This kind of resilient logging infrastructure was built and tested by author using only open-source software. Its behavior was well-predictable and it was tested in different stress conditions, also in condition of minimal operation – in case when only one load balancer and syslog server is left.
Referred articles and literature:
http://www.sans.org/reading_room/whitepapers/hipaa/hipaa-security-compliance-project-identification-logging-auditing-requirements_1227 – HIPAA logging regulations, last visited 24.03.2011
http://tools.ietf.org/html/rfc5426 – RFC syslog standard over UDP, last visited 24.03.2011
http://www.ietf.org/rfc/rfc0768.txt – UDP protocol RFC, last visited 24.03.2011
http://legacyweb.triumf.ca/canarie/amsterdam-test/References/wp-lag-e.pdf – 803.2ad white paper , last visited 24.03.2011
