


The article discusses the dynamics of the long-term distribution of precipitation in East Kazakhstan. A feature of the climatic distribution of precipitation in the eastern part of Kazakhstan was described, factors influencing the climatic distribution were identified, and the conditions for recurrence in the most wet and dry periods were determined. Also, the matrix of paired correlation coefficients was determined during periods of abnormal humidity and dry. The article describes the features of the climatic distribution of precipitation in the eastern part of Kazakhstan. The factors affecting the climatic distribution of precipitation are presented, and the recurrence and macrocirculation of excessively wet and dry periods are considered. The matrix of paired correlation coefficients in abnormally and dry periods has been determined.
Mathematical, statistical analysis and methods of climatic variations were widely used in meteorology to analyze the dynamics of precipitation.
Keywords: precipitation, humid and scarce periods, pair correlation.
Introduction. Exploration and formation of precipitation are topical issues of modern meteorology. There are many scientific articles and monographs, which consider the main aspects of precipitation formation. A. S. Uteshov studied the distribution of precipitation in Kazakhstan, the distribution of annual and seasonal precipitation, daily and annual course, as well as duration. The eastern part of Kazakhstan is characterized by its orthography, and therefore it is of interest to study the dynamics of long-term precipitation [1].
The average monthly precipitation of 1930–2017 was taken as a concrete material for the study of meteorological stations Semey, Ust-Kamenogorsk, Ayagoz and Zaysan, located in east of Kazakhstan.
Research objectives:
− describe the peculiarities of the climatic distribution of atmospheric precipitations in 1930–2017;
— analysis of statistical characteristics of atmospheric precipitations;
— calculation of duplication of humid and scarce periods.
The mathematical method was used to calculate the mean deviation of precipitation time and space at the meteorological stations Semey, Ust-Kamenogorsk, Ayagoz, Zaysan 1930–2017, the statistical method was used to calculate the statistical characteristics of atmospheric precipitations (average squared deviation, variation coefficient, coefficient of asymmetry and kurtosis, correlation coefficient).
The East Kazakhstan region, located to the east of the Republic of Kazakhstan borders on the Altai territory in the north, and China in the south and east. The area is 97,3 thousand sq. km. The majority of the East Kazakhstan region is occupied by the Altai mountains and the South Altai ridges (Sarimsak Ridge, Naryn Ridge, Ulba Ridge, Kurchum Range, Range of Aubey).
The far north is the Keri Ridge (4506 m), the southern part of Tarbagatai, the Saur Ridge, the Kalb Ridge to the west from the Buhtyrma River. The hollow of the Zaysan lake, which lies to the south of the region, is quite flat.
Research area. The climate is very continental, the winter is cold, the summer is warmer. The average air temperature is -16–20 ° C in January, July + 18–22 ° C. The average annual precipitation is about 150–200 mm in the Zaysan basin, 400–500 mm in the intermediate hollows, and 1000–1500 mm in the mountainous areas in the north. The region is rich in surface water (more than 40 per cent of water resources in Kazakhstan are concentrated here) [2].
The article examines the long-term distribution of precipitation in East Kazakhstan's Semey, Ust-Kamenogorsk, Ayagoz, Zaysan stations. Monthly data of atmospheric precipitations were obtained as a source of research for the period 1930–2017 [3].
The study of the climate peculiarities of atmospheric precipitations for the eastern regions of Kazakhstan has begun with a comparison of the average monthly precipitation and the figures from 1930 to 2017 (Figure 1).
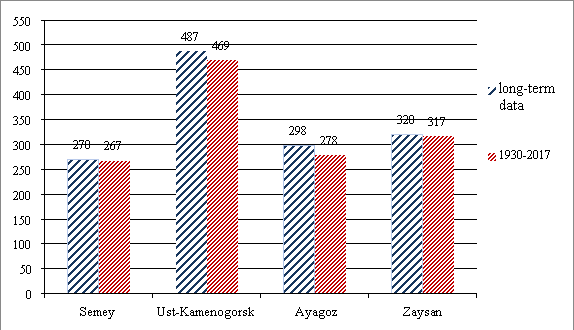
Figure 1. The amount long-term average precipitation and monthly precipitation in 1930–2017: Semey b)Ust-Kamenogorsk c) Ayagoz d) Zayzan
During the comparative analysis of rainfall during the period of data and years of observation, rainfall decreased by 3–20 mm.
The periodic course of the average anomaly of the atmospheric precipitations between 1930 and 2017 was examined.
As shown in figure 2, the periodic course of the average anomaly of the atmospheric precipitations on Semey, Ust-Kamenogorsk, Ayagoz, Zaysan stations between 1930 and 2017 is presented.
|
a) |
b) |
|
c) |
d) |
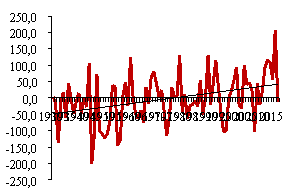
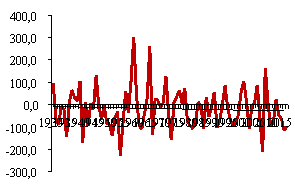
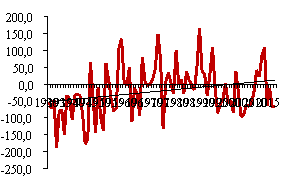
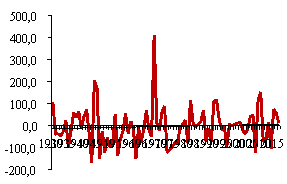
Figure 2. The periodic course of the average anomaly of the atmospheric precipitations between 1930 and 2017: Semey; b) Ust-Kamenogorsk; b) Ayagoz; c) Zaysan
The trendline shows that rainfall has grown on Semey and Ayagoz stations. There was a negative abnormality at Ust-Kamenogorsk station, normally raised at Zaysan station.
The initial climatic parameters characterizing the main climatic series are mean square deviation, asymmetry and coefficient of kurtosis [4].
Comparative analysis of the average long-term value change is based on the base period [5].
The statistical characteristics of atmospheric precipitations were reviewed in periods (Table 1).
Table 1
Statistical characteristics of atmospheric precipitations
|
№ station |
Periods, years |
||||||||||||||
|
1930–1980 |
1961–1990 |
1981–2017 |
|||||||||||||
|
normal,mm |
average squared deviation |
variation coefficient |
asymmetry coefficient |
kurtosis coefficient |
normal,mm |
average squared deviation |
variation coefficient |
asymmetry coefficient |
kurtosis coefficient |
normal,mm |
average squared deviation |
variation coefficient |
asymmetry coefficient |
kurtosis coefficient |
|
|
year |
|||||||||||||||
|
1 |
249 |
13,8 |
66,4 |
1,0 |
1,0 |
268 |
14,0 |
62,1 |
0,9 |
0,8 |
291 |
14,7 |
60,2 |
0,7 |
1,0 |
|
2 |
478 |
25,0 |
63,4 |
1,1 |
1,6 |
476 |
23,2 |
59,1 |
0,9 |
0,7 |
456 |
21,3 |
56,6 |
0,9 |
1,1 |
|
3 |
269 |
17,3 |
77,9 |
1,3 |
1,8 |
313 |
18,5 |
70,3 |
1,1 |
0,9 |
290 |
16,4 |
68,1 |
1,2 |
1,5 |
|
4 |
309 |
19,6 |
80,0 |
1,7 |
5,1 |
317 |
19,4 |
72,5 |
1,1 |
1,6 |
327 |
15,6 |
58,0 |
0,8 |
0,4 |
|
warm period |
|||||||||||||||
|
1 |
168 |
16,6 |
69,1 |
0,9 |
0,5 |
181 |
16,9 |
64,1 |
0,9 |
0,7 |
191 |
17,5 |
65,4 |
0,7 |
-0,2 |
|
2 |
324 |
29,7 |
64,4 |
1,0 |
1,1 |
308 |
26,1 |
59,2 |
0,9 |
0,3 |
289 |
23,8 |
58,4 |
1,0 |
1,8 |
|
3 |
182 |
20,3 |
78,5 |
1,2 |
1,3 |
198 |
21,6 |
75,9 |
1,1 |
0,8 |
186 |
20,2 |
77,7 |
1,4 |
2,2 |
|
4 |
222 |
20,7 |
65,1 |
0,9 |
1,0 |
229 |
21,4 |
65,3 |
0,7 |
0,0 |
238 |
19,4 |
57,5 |
0,6 |
-0,1 |
|
cold period |
|||||||||||||||
|
1 |
81 |
9,9 |
62,9 |
1,1 |
1,7 |
87 |
10,1 |
59,2 |
0,9 |
1,0 |
100 |
10,7 |
53,0 |
0,7 |
2,8 |
|
2 |
154 |
18,5 |
62,0 |
1,3 |
2,4 |
168 |
19,1 |
58,9 |
1,0 |
1,2 |
167 |
17,9 |
54,2 |
0,6 |
0,1 |
|
3 |
87 |
13,0 |
77,0 |
1,6 |
2,6 |
115 |
14,0 |
62,4 |
1,0 |
1,1 |
104 |
11,0 |
54,6 |
0,8 |
0,4 |
|
4 |
87 |
18,0 |
100,8 |
2,8 |
10,8 |
88 |
16,5 |
82,5 |
1,5 |
4,0 |
89 |
10,3 |
58,7 |
1,0 |
1,2 |
*Warning. In the table 1-Semey, 2-Ust-Kamenogorsk, 3-Ayagoz, 4-Zaysan.
1930–1980 and 1981–2017 by comparison, the mean square deviation from the base year (1961–1990) was between 13,8–25,0 and 1981–2017 changed from 14,7 to 21,3. 1930–1980 the variation coefficient is 63,4–80,0; the asymmetry coefficient is between 1,0–1,7; If the coefficient of excitation varies between 1,0–5,1 in 1981–2017, the coefficient of variation is 56,6–68,1; asymmetry coefficient 0,7–1,2; The coefficient of the extremes varied from 0,4–1,5, the variation and the coefficients of the extremes were slightly higher than the base year.
The recurrence frequency of climate change, including precipitation variations, can be summed up in wet and dry periods. In determining wet, extremely wet and dry months, was used the G. V. Leonova and T. A. Bogdanova criterion [6].
If the amount of precipitation exceeds 120 % on average (ΣQ≥120 %), then the year will be relatively wet, if the amount of precipitation is 80 % or lower than the average annual rate (ΣQ≤80 %), it will be dry year.
Precipitation abnormalities were calculated in accordance with the norms of the research year 1930–2017. 1930–2017 the duplication of extremely wet (ΣQ≥120 %) and dry (ΣQ≤80 %) is shown in table 2.
Table 2
In the considered areas of Eastern Kazakhstan, 1930–2017 duplication of extremely wet (ΣQ≥120%) and dry (ΣQ≤80%) periods
|
№ |
observation point |
ΣQ≥120 % |
81≥ΣQ<119 % |
ΣQ≤80 % |
||||
|
number of cases |
% |
number of cases |
% |
number of cases |
% |
|||
|
year |
||||||||
|
1 |
Semey |
61 |
69 |
20 |
23 |
7 |
8 |
|
|
2 |
Ust-Kamenogorsk |
37 |
42 |
49 |
56 |
2 |
2 |
|
|
3 |
Ayagoz |
48 |
55 |
32 |
36 |
8 |
9 |
|
|
4 |
Zaysan |
55 |
63 |
30 |
34 |
3 |
3 |
|
|
warm periods (april-october) |
||||||||
|
1 |
Semey |
16 |
18 |
45 |
51 |
27 |
31 |
|
|
2 |
Ust-Kamenogorsk |
9 |
10 |
60 |
68 |
19 |
22 |
|
|
3 |
Ayagoz |
16 |
18 |
45 |
51 |
27 |
31 |
|
|
4 |
Zaysan |
12 |
14 |
48 |
54 |
28 |
32 |
|
|
cold periods (november-march) |
||||||||
|
1 |
Semey |
30 |
34 |
37 |
42 |
21 |
24 |
|
|
2 |
Ust-Kamenogorsk |
19 |
21 |
43 |
49 |
26 |
30 |
|
|
3 |
Ayagoz |
18 |
21 |
31 |
35 |
39 |
44 |
|
|
4 |
Zaysan |
24 |
27 |
39 |
44 |
25 |
29 |
|
According to table 2, in cold weather, as in the warm season, precipitation is observed. But the recurrence of anomalies of moisture in the cold period is high in Ayagoz, Ust-Kamenogorsk. The maximum number of cases (39) corresponds to the station Ayagoz. Dry years were 1930–1959, 1965, 2000–2007 that is, the amount of precipitation was below 55 % of the average annual rate.
During the year, the number of deficit cases changed from 19 to 28. In the years 1933, 1935, 1936, 1945, 1948, 1955, 1962, 1974–1978, 1997, 2011, the amount of rainfall was 50 % lower than the perennial norm, which reaches 60 % in some years.
The rise of the cold began in the East Kazakhstan in the 1940s. The most wet years were 1943, 1958, 1966, 1971, 1993, 2010, including precipitation in 2010, 70 % higher than the peak year.
At temperate-standing stations, the number of extremely wet conditions ranged from 9 to 16. Extremely wet years are attributed to 1946, 1952, 1958, 1969, 1972, 1979, 1988, 1992, over 60 % of the annual norm.
Thus, in the warmer period, the number of moist moisture increases in recesses, in cold periods. Therefore, negative annual anomalies and annual rainfall values are observed in the warm season due to rainfall.
Conclusion. The main aim of the study was determine the dynamics of the long-term distribution of atmospheric precipitations in the eastern regions of Kazakhstan. Studying the long-term dynamics of the climatic distribution of rainfall in the east of Kazakhstan from Semey, Ust-Kamenogorsk, Ayagoz, Zaysan, between 1930 and 2017, the following conclusion was made:
− During the comparative analysis of rainfall during the period of data and years of observation, rainfall decreased by 3–20 mm, at Ust-Kamenogorsk station negative marker anomaly, Ayagoz, Semey and Zaysan stations had positive anomalies;
− The mean square deviation of atmospheric precipitations varied between 14.3–23.7 years. Variation coefficient 61,2–73,6; the asymmetry coefficient is 0.9–1.7; the extensional coefficient ranged from 0.9 to 5.9;
− The maximum amount of precipitation was in july, in june and august it was 29–36 % of the annual figure. The minimum rainfall was in january and february (7–13 % per year).
References:
- Uteshev A. S. (1959). Klimat Kazakhstana. [Climate of Kazakhstan]. L.: Gidrometeoizdat, p.336
- Wikipedia, Google, last modified February 1, 2019, 20:21, https://kk.wikipedia.org/wiki/Шығыс_Қазақстан_облысы
- Spravochnic po climate SSSR.(1968). L.: Gidrometeoizdat, p.550.
- Kobysheva, N.V. (1988). Skolko harakteristik u klimata. [How many characteristics of the climate]. Man and element, -s.37–38.
- WMO operations manual for chemical constitutions in air and precipitation. WMO № 299, World Meteorological Organization. Geneva, 1974.
- Leonova G. V., Bogdanova T. A. (1975). Anomalya osadkov v iule v iujnoi polovine Evropeiskoi territory SSSR, na iuge Zapadnoi Sibiry I v severnoy chasty Kazakhstana I nekotorye vosmozhnosti eio prognozirovanya. [Anomaly of precipitation in July in the southern half of the European territory of the USSR, in the south of Western Siberia and in the northern part of Kazakhstan and some possibilities for its prediction]. TR.GMC USSR, Issue.166, -s. 312–315.
