


IBM estimates that each day 2.5 quintillion bytes of data are created or replicated. That´s the equivalent of a million hard drives filling up with data every hour. [1] In 2015 data centers occupied the land to equivalent to almost 6,000 football fields. By 2020, the amount of digital information is expected to increase exponencially to more than 7x of what is today. [1]
Big data: the next frontier for innovation, competition, and productivity.
McKinsey Global Institute
Shawn Stone [2] defined that the goal of education in the 21st century is the mastery of information, embedded knowledge and understanding and the advanced use of technology in society. Stone states, It should allow to the students to also master the learning process, to engage with their curriculum, own and direct their learning in their own individual and flexible ways. In this sense, the general consensus of society regarding the education provided by the educational centers is that they should prepare young people for life, work and citizenship.
Camins [3] highlights that debate about the purposes of education never seems to end. The question worth asking is: Should young people become educated to get prepared to enter the workforce, or should the purpose of education be focused more on social, academic, cultural and intellectual development so that students can grow up to be engaged citizens?
We agree with Philip Guo [4] when he states that the main purpose of education is to strengthen our mind so that we can more easily learn to deal with specific challenges you will face throughout our lifes. Knowledge of the natural and engineered environments and how people live in the world is critical to all three purposes of education. [3] Critical thinking, creativity, interpersonal skills and a sense of social responsibility all influence success in life, work and citizenship.
If we consider for practical purposes of discussion in this article that science is a means to develop explanations about how the natural world works, and engineering is a means to develop solutions to human problems. We can say that both are intended to improve our lives, which represents a strong motivator for the development of a new learning process in which we can make sense of the analysis of information (data analytics) and the construction of validation models (descriptive, predictive and prescriptive analytics). We will try to develop the following question in the present work: How can learning analytical data techniques be a source of improvement in the quality of education to face the challenges of innovation, competence, and productivity in the 21st century?
A data-driven world is changing our way of thinking
Emerging technologies in big data, data mining, machine learning and artificial intelligence are fueling a need for innovative curricula in online, traditional and hybrid delivery formats that meet the market needs. Investigations into the psychology of learning and motivation have discovered that many of the practices that make up the modern learning context are inefficient, ineffective or at times directly contrary to the goals of an educational system. This suggests that these systems, despite their long lineage, should be replaced with those that use a full, modern understanding of learning and organizational efficiency. Traditional method followed by the current academic programs at secondary and university levels can be enriched if the information obtained is included and analyzes are carried out using mathemathics and computational thinking, using argument from evidence. The current discussions seek to make contributions of pedagogical research, teaching materials and practices and mention pedagogical cases that address the acquisition, application and continuous development of the knowledge and skills required in the use of data analysis in the classroom, with emphasis on analysis, big data analysis, high performance analysis, data science, visualization and other emerging analytical technologies. Below is a brief summary [3] of how the logic of the process can be understood for purposes of this paper:
- Ask questions about phenomenon (i.e. causes of low productivity, causes of increase of maintenance costs) and define problems that need to be solved (designing operational workflows, Improving operational efficiency).
- Develop and use models. Models represent relevant testable features of scientific explanations or design solutions.
- Plan and carry out investigations. The goals of investigations are to test, refine or replace existing or hypothetical explanations or design solutions.
- Analyze and interpret data
- Use mathematics and computational thinking.
- Constructing explanations and designing solutions
- Engage in argument from evidence.
With the explosion of data, the demand for artificial intelligence and analytics is increasing at a faster rate now than ever before. The measurable value from data is created only after its interpretation and implementation in daily-life processes. Fortunately, education is changing. The information revolution, beginning with the advent of the microprocessor to the modern day, has begun to change the way in which we think about evaluation and interpretation. Statistical methods that were once the domain of scientific research can be leveraged in a classroom, and the introduction of the Internet has provided a whole new platform for learning and expressing itself as modern education. Adapting to an era of more data-driven decision making has not always proven to be a simple proposition for people or organizations. [5] Many are struggling to develop talent, business processes, and organizational muscle to capture real value from analytics. [5] This is becoming a matter of urgency, since analytics prowess is increasingly the basis of industry competition, and the leaders are staking out large advantages.
New technologies allow schools, colleges and universities to analyze absolutely everything that happens. From student behaviour, testing results, careers developments of students as well as educational needs based on changing societies. Big data allow for very exciting changes in the educational field that will revolutionize the way students learn and teachers teach. [6] In this sense, It is important to highlight that Data-driven decision making, is an essential component of emerging science and engineering systems that generate and consume large amounts of autonomous detection data. the academic curricula and the syllabus should focus on the use of technologies and methodologies necessary to infer useful information and identify underlying patterns from often raw, incomplete, noisy and corrupt data that are present in real-life science and engineering applications. New academic guidelines that include data analytics in universities should provide the opportunity to explore advanced data analysis solutions such as sparse coding, compressive detection, nonlocal filtering, generative and discriminative models.
Big Data: Adisruptive innovation
Why is Big Data different from any other data that we have dealt with in the past? There are “four V’s” that characterize this data: Volume, Velocity, Variety, and Veracity. An innovation that creates a new value network and market, and disrupts an existing market and value network by displacing the leading, highly established alliances, products and firms is known as Disruptive Innovation. [7] Clayton M. Christensen and his coworkers defined and analyzed this phenomenon in the year 1995. But, every revolutionary innovation is not disruptive. When a revolution creates a disorder in the current marketplace, then only it is considered as disruptive.
The term ‘disruptive innovation’ has been very popular over the past few years. In spite of many differences in application, many agree on the following.
Disruptive innovations are:
– More accessible (with respect to distribution or usability)
– Cheaper (from a customer perspective)
– And utilize a business model with structural cost advantages (with respect to existing solutions)
– The disruptive innovation coming from big data are big data analytics processes and technologies.
In the Classroom, big data is a disruptive force. It means that people require more than new skills, technologies and tools. They need an open mind to rethink about the educational processes they have followed for a long time and transform the way they learn. However, it is not particularly easy to force this type of change on long-time students. The overall goal of Big Data within the educational system should be to improve student results. Better students are good for society, organizations as well educational institutions. Rijmenam [6] states that the use of Big Data in class environments generates significant changes in student performance and in the flexibility of learning methodologies.
– Improve Student Results
– Create Mass-customized Programs
– Improve the Learning Experience in Real-time
– Reduce Dropouts, Increase Results
The current volume of data created is substantial: it so much that 90 % of the world data has been created in the last two years. [1] so The Economist estimates that there will be roughly 7x more data in 2020 than there was in 2014. [1] Extremely large data sets that may be analyzed computationally to reveal patterns, trends, and associations, especially relating to human behavior and interactions.
Knowing Analytics: The traditional view of academic world in science and engineering.
In today’s academic world, strategic priorities tend to center on meet regulations and follow the syllabus. One of the consequences is that analytics taught in universities often focuses too much on complex maths and statistics rather than long-term value creation. This is even more true as we enter a new era of sustainable value creation in which the pursuit of long-term value has to be driven by sustainably strong organizations.
Data and analytics capabilities have made a leap forward in recent years. The volume of available data has grown exponentially, more sophisticated algorithms have been developed, and computational power and storage have steadily improved. The convergence of these trends is fueling rapid technology advances and business disruptions.
Peter Sondergaard of Gartner Researh states “Information is the oil of the 21st century, and analytics is the combustion engine” [8] Mr. Sondergaard said: “ Pursuing this strategically will create an unprecedent amount of information of enormous variety and complexity. This is leading to a change in data management strategies known as big data. [8]
We will briefly describe the different approaches of academic models in the past and present.
– Business + Math gave rise to the consulting profession. This allowed us to use heuristics and creativity to make persuasive arguments in the boardroom.
– Business + Technology gave rise to the IT profession. This helped us automate algorithmic tasks, thus improving productivity and efficiency.
– Math + Technology inspired interesting software products that helped us address a wide range of business problems and operate proactively with anticipation.
In order to describe in a better way the orientation of skills required for new business.
– Business + Math + Technology are coming together with the behavioral sciences. The behavioral sciences allow us to connect the dots between interactions and develop a deeper understanding of human behavior. Combining that deep understanding with math and technology allows us to create the appropriate incentives to drive behaviors that align to our business goals
The three pinnacle stages in the evolution of data systems
Big Data is the next generation of data warehousing and business analytics and is poised to deliver top-line revenues cost efficiently for enterprises. The greatest part about this phenomenon is the rapid pace of innovation and change; where we are today is not where we ’ll be in just two years and definitely not where we ’ll be in a decade.
Misha Ghosh [9] explains, “Aside from the changes in the actual hardware and software technology, there has also been a massive change in the actual evolution of data systems. I compare it to the stages of learning: dependent, independent, and interdependent.” [9]
– Dependent (Early Days). Data systems were fairly new and users didn ’t know quite know what they wanted. IT assumed that “Build it and they shall come.”
– Independent (Recent Years). Users understood what an analytical platform was and worked together with IT to define the business needs and approach for deriving insights for their firm.
– Interdependent (Big Data Era). Interactional stage between various companies, creating more social collaboration beyond your firm’s walls.
The framework (shown in Figure 1) describes the different kinds of analytics needed:
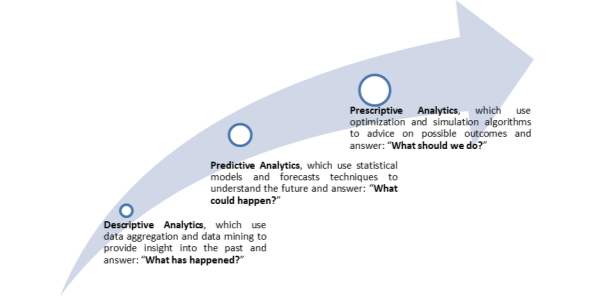
Business Analytics
Fig. 1. Data analytics and the construction of validation models
Each economy has its own particularities, which it is necessary to understand in order to design academic programs aimed at responding to the needs of the society in which the graduated professionals interact. It is because of that we are going to quickly analyze the top ten of the most valuable companies (Market value) in the USA, China, and Russia to establish that data analytics applications can be taught in universities to respond to the needs of the productive sector and the market.
In the top 10 of table 1 (US $ 4,245.0 Bil), we find a large concentration of companies in the digital business that basically concentrate on ecomerce and knowledge of the buying habits of its users. To explain much better the growth of the value of information, we can say that the companies under the acronym GAFA (Google, Amazon, Facebook, and Apple) added more market capitalization than the GDP of India. GAFA companies have become masters at exploiting customer-created value.
To understand the dynamics of the American market it is necessary to understand what happened in the last two decades, start-ups have emerged in the USA as the masters of innovation. Its innovative products and technologies have not only profoundly changed people's lives, but also considerable pressure on the established corporate players. When they reach maturity, most industries slow down in growth or even stop growing. Startups, however, threaten to upset these old industries with new innovations, and large corporations more than ever must innovate and create new businesses in order to survive. Especially given the fact that the pace of disruption of new businesses is accelerating. New software-based technology companies such as Amazon, Facebook, Google, Tesla and Uber, which were small start-up companies only a few years ago, are threatening established players and their core markets today.
Table 1
Top 10. Most Valuable companies in the fortune 500 (2017) [10]
|
Market Value Rank |
Company |
Industry |
Market Value ($Bil) |
|
1 |
Apple |
Computers, office, Equipment |
752.0 |
|
2 |
Alphabet |
Internet services and retailing |
579.5 |
|
3 |
Microsoft |
Computer software |
507.5 |
|
4 |
Amazon.com |
Internet services and retailing |
427.0 |
|
5 |
Berkshire Hathaway |
Insurance: Property and casualty (stock) |
409.9 |
|
6 |
|
Internet services and retailing |
407.3 |
|
7 |
Exxon Mobil |
Oil and Gas |
242.2 |
|
8 |
Johnson & Johnson |
Pharmaceutical |
338.6 |
|
9 |
JP Morgan Cheese |
Investment banking |
306.6 |
|
10 |
Wells Fargo |
Commercial banking |
274.4 |
[Source: statista.com]
In the top 10 of table 2 (China $ 333.2 Bil), we find the companies distributed in three sectors, mainly banking, e-commerce and technology, and oil and gas. Today, most banking, financial services, and insurance (BFSI) organizations are working hard to adopt a fully data-driven approach to grow their businesses and enhance the services they provide to customers. Like most other industries, analytics will be a critical game changer for those in the financial sector.
While many people know that Alibaba is an online retailer, the business model of the company [11] is less well understood and surprisingly different from the e-commerce leader in the United States, Amazon.com, Inc. Three major web portals make up the core of Alibaba's businessː Alibaba, Taobao, and Tmall. All three of these e-commerce websites serve to connect various types of buyers and sellers, wherein Alibaba acts as a middleman.
Table 2
Top 10. Most Valuable companies in China (2017) [12]
|
Market Value Rank |
Company |
Industry |
Market Value ($Bil) |
|
1 |
ICBC |
Industrial & Commercial Bank |
47.8 |
|
2 |
China Mobile |
Mobile voice and multimedia services |
46.7 |
|
3 |
China Construction Bank |
Commercial banking |
41.3 |
|
4 |
Alibaba |
e-commerce, retail, internet |
34.8 |
|
5 |
Bank of China |
Commercial banking |
31.2 |
|
6 |
Sinopec |
Oil and Gas |
29.5 |
|
7 |
PetroChina |
Oil and Gas |
29.0 |
|
8 |
Agricultural Bank of China |
Commercial banking |
28.5 |
|
9 |
Huawei |
Networking, equipment and services |
22.2 |
|
10 |
Tencent |
Internet related services and products. |
22.2 |
[Source: statista.com]
In the top 10 of table 3 (Russia $ 310.8 Bil), we find the companies distributed in two sectors, mainly oil and gas, and banking. The oil and gas industry has witnessed a compelling argument over the past decade to adopt soft computing techniques as upstream problems become too complex to entrust siloed disciplines with deterministic and interpretation analysis methods. We find ourselves in the thick of a data avalanche across the exploration and production value chain that is transforming data-driven models from a professional curiosity into an industry imperative. [13]
At the core of the multidisciplinary analytical methodologies in oil and gas are data-mining techniques that provide descriptive and predictive models to complement conventional engineering analysis steeped in first principles. Advances in data aggregation, integration, quantification of uncertainties, and soft computing methods are enabling supplementary perspectives on the disparate upstream data to create more accurate reservoir models in a timelier manner. Soft computing is amenable, efficient, and robust as well as being less resource intensive than traditional interpretation based on mathematics, physics, and the experience of experts.
Digital oilfields (DOFs) and intelligent wells with multiple sensors and gauges are generating at high velocity a plethora of disparate data defining a complex, heterogeneous landscape such as a reservoir-well facility integrated system. These high-dimensionality data are supplemented by unstructured data originating from social media activity, and with mobile devices proving to be valuable in field operations and cloud computing delivering heightened flexibility and increased performance in networking and data management, we are ideally positioned to marry soft computing methodologies to the traditional deterministic and interpretive approaches. [13]
Table 3
Top 10. Most Valuable companies in Russia (2017) [14]
|
Market Value Rank |
Company |
Industry |
Market Value ($Bil) |
|
1 |
Gazprom |
Oil and Gas |
62.5 |
|
2 |
Rosneft |
Oil and Gas |
51.1 |
|
3 |
Lukoil |
Oil and Gas |
43.5 |
|
4 |
Sberbank |
Commercial banking |
26.9 |
|
5 |
Surgutneftegas |
Oil and Gas |
24.2 |
|
6 |
Norilsk Nickel |
Diversified metals and mining |
29.2 |
|
7 |
Novatek |
Gas production and commercialization |
26.3 |
|
8 |
Magnit |
Food retailer |
20.4 |
|
9 |
VTB Bank |
Commercial banking |
14.6 |
|
10 |
Tatneft |
Oil and Gas |
12.1 |
[Source: investinrussia.com]
Final remarks— Learning Analytics
In today ’s business world, every single business function is questioning the need for analytics. New science and engineering professionals are responsible for discovering information from massive amounts of structured and unstructured data to help shape or meet specific business needs and objectives. The role of the data professional is becoming increasingly important as companies rely more on data analysis to drive decision making and rely on automation and machine learning as core components of their IT strategies. The question that should be asked is the following: Are the universities creating analyitic talent, responding and adapting to the needs of the modern interdependent society based on information?
Creating analytical talent is not a one-time effort but a continuous process. This talent needs to be groomed and nurtured in an environment where art and science can exist in harmony. Data-driven decision making is a journey, and without the right talent across academical levels, the benefits of decision sciences cannot be truly realized. What is needed is an interdisciplinary approach, drawing its foundation from mathematics, business, technology, and behavioral sciences and a culture that nurtures the talent and drives innovation.
In the end, the adoption of an interdependent data analytics approach in the different science and engineering programs in universities is reduced to people. The best intentions can go wrong if the objectives of the analytical academics and the final business consumers are not aligned This is even more critical given the highly iterative nature of analysis, which requires generators and consumers to work closely continuously. The three main activities that must occur to guarantee the success of university programs that respond to real realities are:
– Organizational alignment: Universities should define priority sectors and problems that must be solved and define route maps that have a time limit but at the same time measurable and achievable. As intuitive as it may sound, without focus and direction, no process or technology will make a difference.
– Endorsement and sponsorship of the government and the productive sector. It is important for the university leadership team to support fact-based decision making and identify data consumers. Identifying consumers also requires walking the corridors of companies, socializing ideas and maneuvering the dynamics in several business groups. Without conscious focus on these activities, visually rich reports or sophisticated statistical models will not generate any real commercial value.
– Investing in analytical human capital. The university needs to mobilize resources required for analytics and hire the right talent and retain them. There is an increasing demand for analysts who can learn new skills as the situation demands, be it math, science, business, or technology.
Big data is the intersection of business strategy and data science, offering new opportunities to create competitive advantages. It allows companies to use data as a strategic asset, equipping them with pertinent real-time information when making decisions in order to eliminate inefficient operating processes, enhance the customer experience, take advantage of new markets, etc. Big data represents Learning.
Universities have traditionally based their academic models on knowing instead of learning. Learning and knowing are two completely different things. Learning comes with experience and is associated with taking risks. Knowing is more about prior knowledge (i.e., “gut feeling”) or, perhaps, the result of being “told” that a certain fact is true without questioning it. It is the converse of learning and often not based on fact. It is necessary that the universities open the way to a new educational model in which the Knowing will be displaced by the Learning.
References:
- Desjardins, J; Order from Chaos: How Big Data will change the world (Cited july 29th 2015), retrieved from https://www.visualcapitalist.com/order-from-chaos-how-big-data-will-change-the-world/
- Stone, Shawn; The goal of education in the 21st century (cited July 2nd 2014) Retrieved from https://www.teacherswithapps.com/the-goal-of-education-in-the-21st-century/
- Cammins, Arthur; What´s the purporse of education in the 21st century? (cited february 12nd 2015) Retrieved from https://www.washingtonpost.com/news/answer-sheet/wp/2015/02/12/whats-the-purpose-of-education-in-the-21st-century/?noredirect=on&utm_term=.98dbb0038f6e
- Guo, Philip; The main purporse of Education, (cited october 2nd 2010) Retrieved from http://pgbovine.net/purpose-of-education.htm
- Mckinsey & Company, Mckinsey Global Institute, The Age of Analytics: Competiting in a data driven world (December 2016).
- Rijmenam, Mark; DATAFLOQ; Four ways Big Data will revolutionize education, Retrieved from https://datafloq.com/read/big-data-will-revolutionize-learning/206
- Ravindra, Savaram; Big Data´s potential for disruptive innovation (July 10th, 2017), Retrieved from http://dataconomy.com/2017/07/big-data-disruptive-innovation/
- Gartner, Press Release (October 17th 2011) retrieved from http://gartner.com/newsroom/id/1824919
- Minelli, M; Chambers, M; Dhirai A. (2013) Big Data Analytics — Emerging business intelligence and analytic trend for today´s business. John Wiley & Sons, inc.
- Retrieved from https://www.statista.com/statistics/263264/top-companies-in-the-world-by-market-value/
- Blystone, D; Investopedia, Understanding the Alibaba´s business model, Retrieved from https://www.investopedia.com/articles/investing/062315/understanding-alibabas-business-model.asp
- Retrieved from https://www.statista.com/statistics/259063/most-valuable-chinese-brands/
- Holdaway, Keith (2014) Harness oil and gas Big data with analytics- Optimize exploration and production with data- driven models. Willey, SAS Institute Inc.
- Retrieved from https://ru.investinrussia.com/russia-200
