


Abstract. The potential of electric power generation from marine tidal currents is enormous. Tidal currents are being recognized as a resource to be exploited for the sustainable generation of electrical power. The high load factors resulting from the fluid properties and the predictable resource characteristics make marine currents particularly attractive for power generation and advantageous when compared to other renewable energies. Moreover, international treaties related to climate control have triggered resurgence in development of renewable ocean energy technology. Therefore, several demonstration projects in tidal power are scheduled to capture the tidal generated coastal currents. Regarding this emerging and promising area of research, this paper reviews marine tidal power fundamental concepts and main projects around the world. It also report issues regarding electrical generator topologies associated to tidal turbines. Moreover, attempts are made to highlight future issues so as to index some emerging technologies mainly according to relevant works that have been carried out on wind turbines and on ship propellers.
Keywords: renewable energy, potential energy, tidal current, prototype model, generated electricity.
- Introduction
A plenitude of renewable energy options is offered by oceans, that encompasses over 70 % of the total mass of our blue planet. Oceans are an exuberant source of reliable, indigenous and sustainable power supply. Principally, ocean power can be harnessed in three basic forms- ocean thermal, wave and tidal energy. Reliability and high predictability of tides, compared to ocean thermal and wave energy is something that elevates the tidal energy. By the end of 2016, global energy accounted to 536 MW, mostly contributed by tidal power generation [1]. Tidal energy can further be harnessed in two ways- potential energy and kinetic energy. The former is captured within the water level difference during flood and ebb tide which can be exploited using a tidal barrage. The latter develops due to tidal currents and can be harnessed with the help of tidal current turbines, featuring working principles of axial flow, cross flow, oscillating hydrofoil turbines is reported in [2].
The tidal height difference or water level variation created between high and low tide is utilized to generate tidal range power. Historically, the most common and commercially viable approach of harnessing this energy is the construction of tidal barrage. There are different operating methods of power generation that can be carried out within a tidal barrage [3]. Principle feature of these methods includes three significant phases: the filling phase when water fills the artificial basin, the holding phase when water is held on either side of a sluice gate in order to create the necessary tidal range, and finally the generation phase when water is allowed to flow through turbines to generate electricity. This basic principle of tidal barrage technology is one of the leading methods for tidal energy extraction. With the gradual depletion of traditional fossil fuels and rising concerns over climate change issues, the pursuance of exploring the renewable resources has become an urgency. In recent years, global interest has shifted towards the advancement of research on tidal energy prospects, along with the development of tidal energy converters and progression of lab-scale tests on prototype devices. In this paper, a low-cost, small-scale prototype is designed based on the tidal barrage concept. A horizontal axis turbine is developed and experimented inside modular flow channel of a Parshall flume. The key objectives of this paper are to study the dynamic behavior of tidal devices and observe the turbine performance in artificial tidal flows. Finally, a comparison of the experimentally extracted power of the lab-scale prototype and theoretically obtained results are provided for validation and evaluation of the prototype model [3–6] as shown in the fig 1.
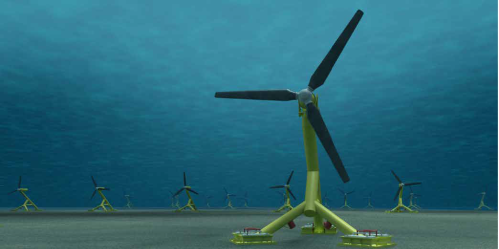
Fig. 1. Tidal Turbine
2. Physical principles of tidal energy
Gravitational interaction between the moon, the sun, and the earth attributes the rhythmic rising and lowering of tidal height. The attraction force exerted by the moon or the sun on a molecule of water can be calculated as f = KMm/d2,
Where f is the attraction force, K is the universal constant of gravitation, M is the mass of the moon or sun, m is the mass of a water molecule, and d is the distance from a water molecule to the moon/sun. Due to the less distance between the moon and the earth, the moon exerts 2.17 times greater force on the tides as compared to the sun. As a result, the tide closely follows the moon during its rotation around the earth, bulging along the axis pointing directly at the moon. When the sun and the moon are in line, whether pulling on the same side or on the opposite side, their gravitational forces are combined together and this results in a high “spring tide”. When the moon and the sun are located at 90◦ angle to each other, their gravitational force pulls the water in different directions, causing the bulges to eliminate each other’s effect. This results in a smaller difference between high and low tides, which is known as a “neap tide” The concepts of spring tide and neap tide. The period between the two spring tides or neap tides is around 14 days, half of the lunar cycle. The range of a spring tide is commonly about twice as that of a neap tide, whereas the maximum period cycles impose smaller perturbations. Tidal wave can also be reinforced by reflections between the coast and the shelf edge, and funneling effect (due to the shape of the coastline as the tidal bulge progresses into a narrowing estuary), In addition, tide can also be diurnal (one tidal cycle per day with a period of 24 h and 50 min) or mixed (with a tidal cycle intermediate between a diurnal tide and a semidiurnal tide) as shown in the fig 2 [4].
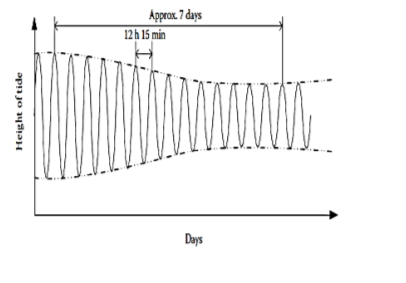
Fig 2. Tidal variation during a week
3 .Project components: The project comprised multiple work-packages of which two are discussed herein, namely those relating to the TEC machine, (MC) and the numerical and analytical modeling, (MD) works underpinned by field measurements. The component parts of the MD programmer designed to provide (i) improved environmental understanding and (ii) improved engineering tools are shown in Table I which relates tasks to the project technical reports (see Fig.3) [5].
![]()

Fig. 3. General scheme of a marine current conversion system
3.1. Modelling activities driving field measurement campaign specification: Within the modelling work package numerical modelling work was undertaken by E.ON, DNV-GL and EDF.
MD1 involved cutting-edge numerical simulation (conducted on EDF’s IBM Blue Gene supercomputer) of the Alstom 1MW tidal turbine in turbulent flows [6]. The construction and validation of a model of the wider Fall of Warness, Orkney site [7], [10] was carried out under MD5 and incorporated both existing EMEC datasets and new Uo E field measurements for model calibration and validation as part of MD2. MD6 involves the validation — through comparison to field and machine data — of the DNV-GL RA Tidal Bladed software which seeks to capture environmental and turbine characteristics in a desktop application [8] as shown in the fig 3 and fig 4.
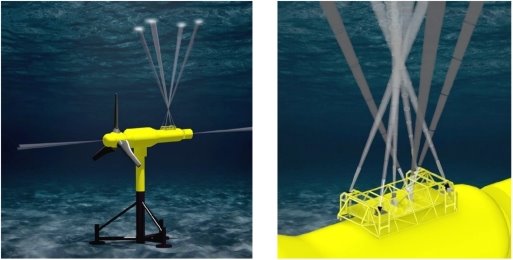
Fig 4. Photograph of ESIP
3.2.Campaign specifications and methodology
A. Acoustic Doppler Profiling
Following a review of available technology the primary technique adopted for acquiring flow velocities from multiple locations was acoustic Doppler velocimetry using instruments and instrument-arrays of the classes: divergent, convergent and orientable single-beam, herein labelled respectively DADP, C-ADP and SB-ADP. Acoustic Doppler Profilers (ADP) have been successfully used to characterize the mean flow conditions and energy flux in several sites for TEC installations [9]. Conventional ADPs emit acoustic allusion from a number of transducers installed on a single device. While a variety of beam configurations exist, in order to deduce a three-dimensional velocity measurement, these acoustic beams must be transmitted in at least three directions [10] which necessitates, for a single instrument, that beam directions are diverging. During ReDAPT multiple single beam 1MHz ADPs were procured operating on a newly available prototype communications and software platform that enabled instruments to be aligned in any direction (e.g., stream wise, transverse, vertical) whilst offering faster sample rates and accurate control of triggering. This flexible system of instruments offered new opportunities for flow description and latterly wave measurement including the deployment of a prototype converging Acoustic Doppler profiler.
B. System integration and commissioning trial on the predecessor 500KW Tidal Energy Converter
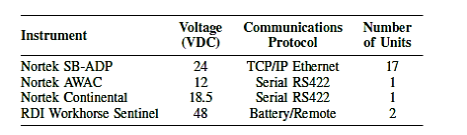
To gain experience on data acquisition and analysis trial deployments were agreed, planned and conducted on the existing Alstom 500kW DEEPGEN III. Five Nortek single beam ADPs (SB-ADP) were installed to brackets welded in-situ at the top rear of the turbine orientated to capture velocities in the streamwise, transverse and vertical directions. A Nortek AWAC 1MHz D-ADP was installed to the top rear of the turbine orientated vertically (upwards) and a long range low frequency (192kHz) Nortek Continental SB-ADP was installed at the top rear of the turbine orientated backwards along the streamwise direction. Table I epitomize the instruments used (across this and subsequent campaigns) and their electrical and communication protocol configurations.
Table 1
Selection of instruments used across the 500KW and 1MW TEC deployments
C. System integration on the 1MW Tidal Energy Converter
instrumentation systems were installed and commissioned on the 1MW machine. The instrumentation methodology involved two seabed mounted RDI Teledyne Workhorse Sentinel 600kHz D-ADPs deployed either side of the turbine along the primary flow direction to provide depth profiles and um-impeded inflow (and reference) velocities to the turbine. These deployments are shown in Fig. 5. On DEEPGEN IV three instrumentation mounting points were allocated: one on the top of the rear of the turbine nacelle — where the Edinburgh Subsea Instrumentation Platform 1 (ESIP-1) was installed, one on the rear of the turbine — where ESIP-2 was installed and a single sensor on the center line of turbine rotating hub. ESIP-1 can be seen in Fig. 4. Fig. 5 shows typical seabed mounted D-ADP campaigns photographs taken from on-board the deployment vessel the KML Severn Sea [11].
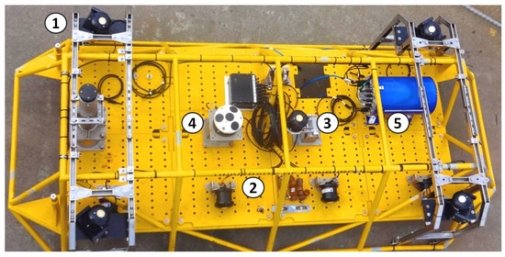
Fig 5. Photograph of ESIP-1 taken from scissor lift platform showing instrumentation mounted atop the 1MW TEC at Hatston Quay, Kirkwall, Orkney prior to turbine deployment
3.3 Energy Storage System
In this paper, an ESS based on supercapacitors is adopted [5], [6]. Figure 2 illustrates a supercapacitor-based ESS and the bidirectional DC/DC converter. Its model is given by (1) to (3).
Vess= Lsc
Vsc = Rsc I sc + usc …………..2
The current transferred between DC-bus and supercapacitor is given by:
iess = Sessisc …………..3
![]() =
= ![]() —
— ![]() …………..4
…………..4
The reference DC-bus currents are given by:
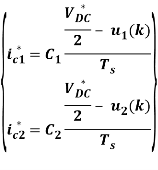 ………….5
where ![]() DC is the reference DC-bus voltage.
DC is the reference DC-bus voltage.
The reference grid currents in the rotating reference frame dq are given by:
![]()
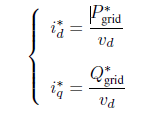
where ![]() and
and ![]() are the reference active and reactive powers injected to the electrical grid. The reference grid currents in the natural base abc can be obtained through the Concordia and Park transforms.
are the reference active and reactive powers injected to the electrical grid. The reference grid currents in the natural base abc can be obtained through the Concordia and Park transforms.
4. Results
In this section, several simulation results are presented to validate the proposed power smoothing and LVRT enhancement strategy. These simulations are carried out in the Matlab/Simulink environment. The IGBT switches are considered to be ideal. The 5-phase PMSG and other principal devices are simulated using the dynamical equations given in our previous work [12]. The simulation sampling time is set to T sample = 10−6s. Switches states (Sabc, SEES, and Sabcdef) are computed at each control sampling time (T control = 2.10−5s) by the three proposed MPC algorithms. The cost coefficient k is set to 50.000 in these simulations.
The grid-connected 5-phase PMSG-based tidal turbine parameters are listed in the Appendix.
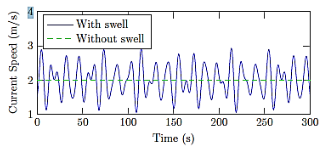
Fig 6. Tidal speed under the swell effect.
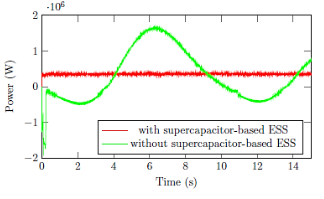
Fig 7. Active power with/without the super capacitor-based ESS
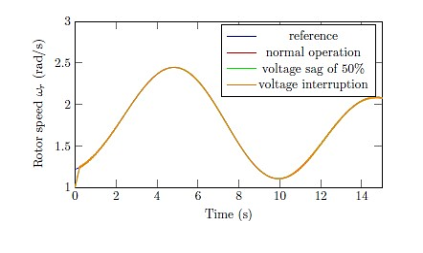
Fig 8. Rotor speed.
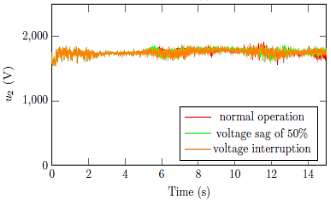
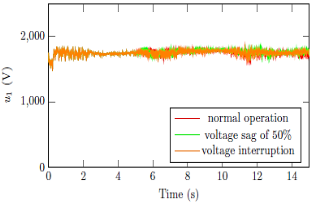
Fig 9. DC-bus voltages.
The output power smoothing performance is evaluated when the system operates under the swell effect. The simulations are based on real tidal speed data measured at the Raz de Sein site in Bretagne, France as shown in Fig. 6. Figure 7 shows the active power injected into the grid when considering the swell effect. The simulations under voltage sags are also carried out to evaluate the LVRT ability without disconnecting from the grid. The two following fault scenarios are presented: (a) the grid voltages decrease to 50 % of the rated value during 5s (from 5 to 10s) and (b) the voltages are totally interrupted during 0.3s (from 5 to 5.3s). It should be mentioned that faults duration is two times longer than the requirements of grid codes. The 5-phase PMSG rotor speed is shown in Fig. 8. In both normal and faulty modes, the generator achieves good tracking performances. The tidal turbine remains at its maximum power point and the generated energy is then maximized. The DC-bus voltages, presented in Fig. 9, remain at its reference value with small fluctuations. The grid line currents, active, and reactive power are given in Figs. 10, 11 and 12, respectively.
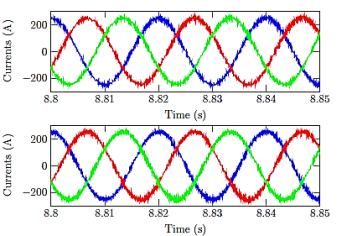
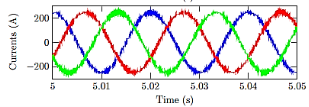
Fig 10. Grid currents for normal operation (top), voltage sag of 50% (middle) and voltage interruption (bottom).
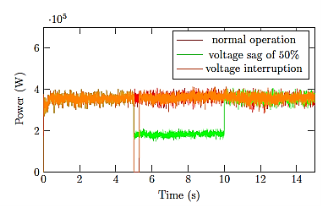
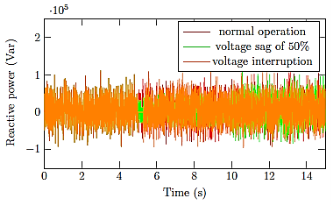
Fig 11. Active power.Fig 12. Reactive power speed.
The average power variation is about 27 %. This is inevitable and depends on the sampling time Ts. A smaller sampling time will improve the power quality but this requires more powerful calculation capacities. It is interesting to note that there is no difference between normal and faulty operations. The LVRT capacity is improved and the system can ride-through the most severe grid voltage sags
Conclusion
Tidal energy is a result of the orbital kinetic energy of the moon, earth, and sun. It provides zero gas, solid, or radiation pollution and is an inexhaustible supply of energy. As a kind of green energy, tidal energy has some significant merits. Tidal power energy does not depend on the season or the weather type, so it is more predictable, compared to other sources of energy such as wind or solar energy.
To clarify the characteristics which are important indicators in the design of a water turbine for use in tidal power generation, the characteristics of the output, the solidity, the number of blades in the water turbine, and the starting torque were measured in water channel tests, and the following results were obtained.
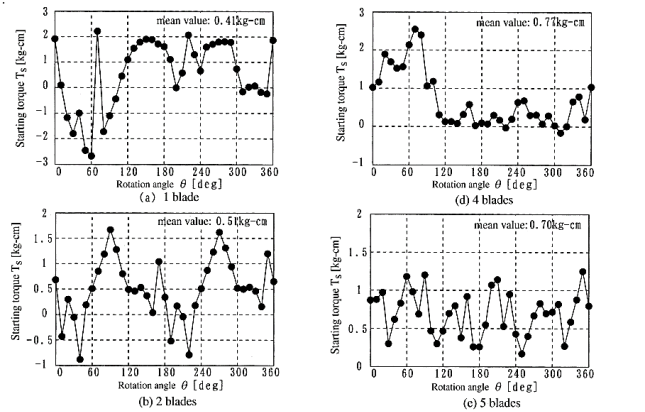
Fig. 13. Starting torque characteristics (V = 0.8, V = 0.179).
(1) The characteristics exhibit almost identical trends in the water turbine efficiency and tip speed ratio unrelated to the flow speed. The maximum output of a water turbine was clearly shown to be proportional to the cube of the flow speed.
(2) For a constant number of blades, the water turbine efficiency reaches a maximum at a solidity of 0.179. The generated torque increased as the solidity increased.
(3) The average starting torque in one rotation increases for three or more blades. For four or more blades, there are no regions of rotational angles where the torque becomes negative during one rotation, and the distribution becomes flat. Thus, starting becomes easy.
References:
- Md. Alamgir Hossain, Md. Zakir Hossain, Md. Atiqur Rahman,” Perspective and Challenge of Tidal Power in Bangladesh”, World Academy of Science, Engineering and Technology International Journal of Electrical, Robotics, Electronics and Communications Engineering Vol:8 No:7, 2014
- H. Chen, N. A¨ıt-Ahmed, M. Machmoum, and M. E. H. Zaim, “Modeling and vector control of marine current energy conversion system based on doubly salient permanent magnet generator,” IEEE Trans. Sustain. Energy, vol. 7, no. 1, pp. 409–418, Jan. 2016.
- Z. Zhou, M. E. H. Benbouzid, J. F. Charpentier, F. Scuiller, and T. Tang, “Developments in large marine current turbine technologies — A review,” Renewable and Sustainable Energy Reviews, vol. 77, pp. 852–858, May 2017.
- Frouard, J., and Efroimsky, M. 2017. “Tides in a body librating about a spin-orbit resonance. Generalisation of the Darwin-Kaula theory.” Celestial Mechanics and Dynamical Astronomy.
- Z. Zhou, F. Scuiller, J. Charpentier, M. E. H. Benbouzid, and T. Tang, “Power control of a nonpitchable PMSG-based marine current turbine at overrated current speed with flux-weakening strategy,” IEEE J. Ocean. Eng., vol. 40, no. 3, pp. 536–545, Jul. 2015.
- J. McNaughton, S. Harper, R. Sinclair, and B. Sellar, “ Measuring and modelling the power curve of a Commercial-Scale tidal turbine.” Proceedings of the 11th European Wave and Tidal Energy Conference (EWTEC) Nantes, France, 2015.
- Z. Q. Hu, L. Li, J. Wang, Q. H. Hu, M. C. Shen, Dynamic responses of a semi-type offshore floating wind turbine during normal state and emergency shutdown, China Ocean. Eng. 30 (1) (2016).
- Efroimsky, M. 2017. “Dissipation in a tidally perturbed body librating in longitude.” Submitted. https://arxiv.org/abs/1706.08999.
- B. Sellar, S. Harding, and M. Richmond, “High-resolution velocimetry in energetic tidal currents using a convergent-beam acoustic Doppler profiler,” Measurement Science and Technology, vol. 26, no. 8, p. 085801, 2015. [Online]. Available: http://stacks.iop.org/0957–0233/26/ i=8/a=085801
- “ReDAPT — Public Domain Report: Final (MC7.3),” Alstom Ocean Energy, Tech. Rep., August 2015.
- Salmon, J., and Canup, R.M. 2017. “Accretion of Saturn’s inner mid-sized moons from a massive primordial ice ring.” The Astrophysical Journal, Vol. 836, article id. 109.
- Efroimsky, M., and Makarov, V. V. 2017. “Differentiation of large icy moons by tidal heating.” In preparation.
