


Renewable energy sources have become a popular alternative electrical energy source where power generation in conventional ways is not practical. Now a day’s electricity is most needed facility for the human being. All the conventional energy resources are depleting day by day. So we have to shift from conventional to non-conventional energy resources. In this, the combination of two energy resources is takes place i. e. wind and solar energy. This process reviles the sustainable energy resources without damaging the nature. We can give uninterrupted power by using hybrid energy system. Basically this system involves the integration of two energy system that will give continuous power. Solar panels are used for converting solar energy and wind turbines are used for converting wind energy into electricity. This electrical power can utilize for various purpose. Generation of electricity will be takes place at affordable cost. This paper deals with the generation of electricity by using two sources combine which leads to generate electricity with affordable cost without damaging the nature balance.
Keywords: hybrid generation, photovoltaic, solar energy, wind energy.
Introduction:
With increasing concern of global warming and the depletion of fossil fuel reserves, many are looking at sustainable energy solutions to preserve the earth for the future generations. Other than hydro power, wind and photovoltaic energy holds the most potential to meet our energy demands. Alone, wind energy is capable of supplying large amounts of power but its presence is highly unpredictable as it can be here one moment and gone in another. Similarly, solar energy is present throughout the day but the solar irradiation levels vary due to sun intensity and unpredictable shadows cast by clouds, birds, trees, etc. The common inherent drawback of wind and photovoltaic systems are their intermittent natures 2 that make them unreliable. However, by combining these two intermittent sources and by incorporating maximum power point tracking (MPPT) algorithms, the systems power transfer efficiency and reliability can be improved significantly [1]. When a source is unavailable or insufficient in meeting the load demands, the other energy source can compensate for the difference. Several hybrid wind/PV power systems with MPPT control have been proposed and discussed in works Most of the systems in literature use a separate DC/DC boost converter connected in parallel in the rectifier stage o perform the MPPT control for each of the renewable energy power sources Hybrid power systems usually integrate renewable energy sources with fossil fuel based generators to provide electrical power. They are generally independent of large electric grids and are used to feed loads in remote areas. Hybrid systems offer better performance, flexibility of planning and environmental benefits compared to the diesel generator based stand-alone system. Hybrid systems also give the opportunity for expanding the generating capacity in order to cope with the increasing demand in the future. Remote areas provide a big challenge to electric power utilities. Hybrid power systems provide an excellent solution to this problem as one can use the natural sources available in the area e. g. the wind and/or solar energy and thereby combine multiple sources of energy to generate electricity. In this project we are discussing about the grid integrated wind-PV hybrid system with maximum power extraction. [2]
Renewable Energy Resources
Renewable energy resources are the ones that are persistently available and renewing itself with the time. Industrialization and increasing world population has remarked the use of renewable energy resources. Solar power, wind power, biomass, tide power, wave power, geothermal power is known ones [3].
1. Solar Power
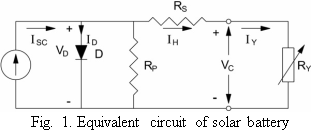
Solar panels are the medium to convert solar power into the electrical power. Solar panels can convert the energy directly or heat the water with the induced energy. PV (Photovoltaic) cells are made up from semiconductor structures as in the computer technologies. Sunbeam is absorbed with this material and electrons are emitted from the atoms that they are bounded. This release activates a current. Photovoltaic is known as the process between beam absorbed and the electricity induced. With a common principle and individual components, solar power is converted into the electric power. Solar batteries are produced by waffling p-n semiconductors. A current-volt characteristic of the PV in the darkness is very similar to that of diot. Under beam, electron flow and current occurs. In closed-loop, PV current passes through the external load. While in open-loop, the current completes the circuit through the p-n diot structure [4]. Solar batteries can be represented with an equivalent circuit of a current source, a resistor and a diot in parallel, and an external load-resistor [5], as seen in Figure 1.
It is possible to insert AC-DC converter, charger, accumulator, extra power source, and controller depending on the design differences in operational and functional specifications [6]. Solar system could be categorized into two types:
Line-independent systems: These are established in absence of line electricity to provide electricity. Since the current in these systems are DC and it must be also available overnight, energy is stored in accumulators, DC-Batteries. In case of AC-Supply requirements for the appliances, it is possible to use DC-AC invertor [6].
Line-dependent systems: These systems do not need DC Batteries, since the energy is served to the demand with the help of an invertor. Line electricity is being switched in use in case of insufficient sun beam [6].
2. Wind Power
Wind turbines are used to convert the wind power into electric power. Electric generator inside the turbine converts the mechanical power into the electric power. Wind turbine systems are available ranging from 50W to 2–3 MW. The energy production by wind turbines depends on the wind velocity acting on the turbine. Wind power is used to feed both energy production and consumption demand, and transmission lines in the rural areas.
Wind turbines can be classified with respect to the physical features (dimensions, axes, number of blade), generated power and so on. For example, wind turbines with respect to axis structure: horizontal rotor plane located turbines, turbines with vertical or horizontal spinning directions with respect to the wind. Turbines with blade numbers: 3-blade, 2-blade and 1- blade turbines.
On the other hand, power production capacity based classification has four subclasses [7].
‒ Small Power Systems
‒ Moderate Power Systems
‒ Big Power Systems
‒ Megawatt Turbine
Material and Method
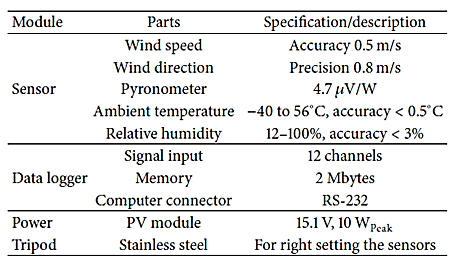
1. Solar Evaluation Instruments and Measurements. The solar-wind meteorological station is located on the roof of Table 1: Main characteristics of the Solar-Wind Meteorological Station at the Solar Energy Institute.
Table 1
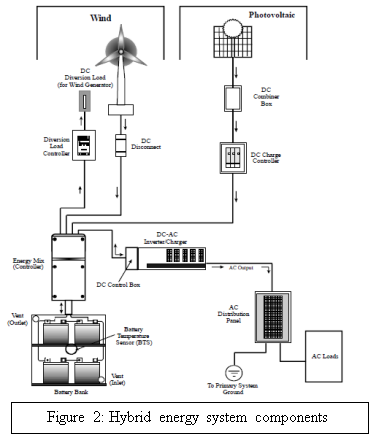
2. PV-Wind Hybrid System.
PV-wind hybrid energy system’s main components are shown in Figure 1. PV array and wind turbine generate energy for the load. Battery stores excess energy and supplies the load when the generated energy is not enough for the load. Battery charge controllers keep battery voltage within specific voltage window and thus, they prevent over discharge or overcharge regimes. To protect the battery against overcharging, PV array and wind generator is disconnected from the system when the DC bus voltage increases above Vmax-off and when the current required by the load is less than the current generated by the PV array and wind generator. They are connected again when DC bus voltage decreases below Vmax-on. To protect the battery against excessive discharging, the load is disconnected when the DC bus voltage falls below Vmin-off and when the current required by the load is greater than the current generated by the PV array and wind generator. The load is switched on when DC bus voltage increases above Vmin-on. The inverter converts generated energy from DC to AC for an AC load.
3. PV Module Performance Model.
A PV module consists of a number of solar cells connected in series and parallel to obtain the desired voltage and current output levels. Each solar cell is basically a p-n diode. As sunlight strikes a solar cell, the incident energy is converted directly into electrical energy.
Single-diode mathematic model is applicable to simulate silicon photovoltaic cells, which consists of a photocurrent source Iph, a nonlinear diode, and internal resistances RS and Rp, as shown in Figure 1.
In the manufacturer’s datasheets, usually basic electrical characteristics of a PV module are given. We are obtain short-circuit current, open circuit voltage, and the maximum power point (MPP) current and voltage values that are available in the datasheet. In addition, the manufacturer’s datasheet provides PV cell temperature coefficients referred to as current and voltage. Module current and voltage values depend on temperature and irradiance. The temperature coefficient of the cell referred to as voltage is negative and large. On the other hand, the temperature coefficient of current is positive and small. In some PV cell models, current variations with temperature can be neglected, and the voltage variations with temperature are defined for a PV module consisting of Nc cells connected in series [5]. The operating temperature of the cell, which differs from the ambient temperature, determines the open-circuit voltage. The operating temperature of a cell can be calculated using (1) for a given ambient temperature [6] as series [5].
Tc = Ta + 0.03.Ga(1)
where Tc is the operating cell temperature, Ta is the ambient temperature in Kelvin, and Ga is the irradiance in W/m2. Open-circuit voltage of the cell can be calculated using
![]() =
=![]() +(-2.3mV/C)(TC-
+(-2.3mV/C)(TC-![]() )(2)
)(2)
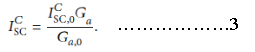 For the PV cell, the short-circuit current is proportional to the irradiance where the open-circuit voltage is a logarithmic function of the current. Using (3), short-circuit current of a PV cell can be calculated for a given irradiance [7]:
PV module’s short-circuit current is proportional to the number of parallel connected PV modules: ![]() =NPC.
=NPC.![]() 4
4
PV module’s open-circuit voltage can be calculated using
![]() =NSC ⋅
=NSC ⋅![]() 5
5
The equivalent series resistance of the module can be calculated as
![]() =
= ![]() ⋅
⋅ ![]() 6
6
The PV module’s current IM under arbitrary operating condition can be described as
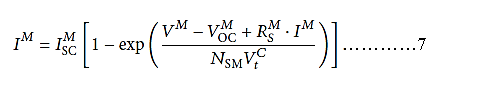
The necessary number of PV modules to be connected in series is derived by the number of modules needed to match the bus operating voltage as depicted in
VPV =![]() ⋅ NSM8
⋅ NSM8
The current output of a PV array at time t, IM (t), is related to the number of parallel strings as [30] I PV(t) = I M (t) ⋅ N PM ⋅ f M M. 9
The power output of the PV array at time t is
P PV (t) = I PV. VPV10
4. Wind Turbine Performance Model.
Characteristic curves for wind turbines are given as power output versus wind speed at the hub height. Wind turbines are never connected in series [8]. Several wind turbines can be connected in parallel to match the system current requirements. This can be done with parallel strings of the same wind turbine type or with strings of a different wind turbine type. It is assumed here that at most two different turbine types are used at the same time in one system as shown in Figure 3 and 4. Yearly energy densities for wind are calculated using
P WT(t) = 0.5 ⋅CP ⋅ ρair ⋅ v311
If we assume the average yearly energy demand as D, we can determine average wind turbine diameter DWT using (12), so that wind turbine type can be defined easily [9]:
DWT =
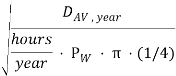 12
12
The power output of the wind turbine array at time t is
P WT (t) = 0.5 ⋅CP ⋅ ρair ⋅ v3 (t)13
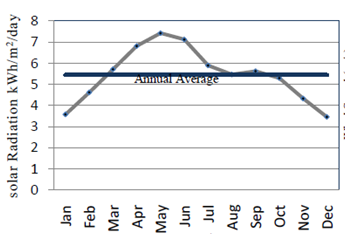
Figure 3. Monthly means of daily load profile of PV-wind hybrid system
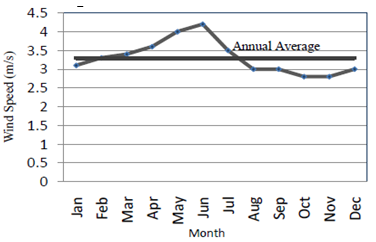
Figure 4: Hourly average of solar radiation data for 12 months of the year
5. Battery Performance Model.
Batteries in a hybrid system are connected in series to obtain the appropriate nominal bus voltage. Therefore, the number of batteries connected in series for the same type of battery in a battery bank is calculated as follows
NSBa t = ![]() 14
14
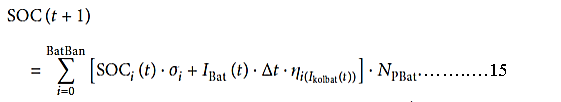
The hybrid system can have several different types of battery banks. The battery state of charge of a battery bank at time t is calculated based on adding the charge current (positive sign) or discharge current (negative sign) to the battery bank state of charge at the previous time instant. When adding the battery current to the battery state of charge, self-discharge losses and battery charging losses should be taken into account [10] [12]:
6. Inverter, Charger, and Loads Performance Model.
The inverter characteristics can be described by the inverter input-output relationship. Some of the power supplied to the inverter will be lost due to transformation losses that are named inverter efficiency losses, ηinv [11]:
Pinv-ip ⋅ ηinv = Pinv-op, ηinv = (Pinv-op) ………..16
Results and discussion
The Dadakharka site located at Latitude (270 23’ 50’’) and Longitude (860 44’ 23’’) consisting 2C10 CDMA BTS, VSAT and Repeater Station of NT is taken as a case study for this purpose of this study. The existing system consists two 3.06 kW Kyocera KC85T PV array connected in parallel and the output of PV array is fed to charge regulator. Since, the bus voltage of telecommunication is 48V, for each array 4 panels are connected in series to provide fixed bus voltage and 18 panels are connected in parallel to meet the telecommunication load. The output of the charge regulator is connected to the battery so that it provides constant charging process. Instead of providing renewable power direct to load, all the energy generated from renewable resources is charged to the battery. The battery used is Narada GFM-800 of 800AH capacity with 2 battery bank where 24 batteries each of 2V are connected in series to meet bus voltage resulting in 48 batteries. Similarly, the power generated from the 1kW Hummer H3.1 DC wind turbine operating at 48V is fed to the hybrid solar/wind controller and the output of hybrid solar/wind controller is fed to the battery. Finally, the output voltage from the battery is fed to the charge controller so that it provides constant power to the load. Thus, the existing system with 6.12kW PV Array, 1 kW wind turbine and 1600AH battery bank provides the power supply to the remote station telecommunication load.
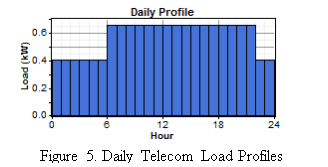
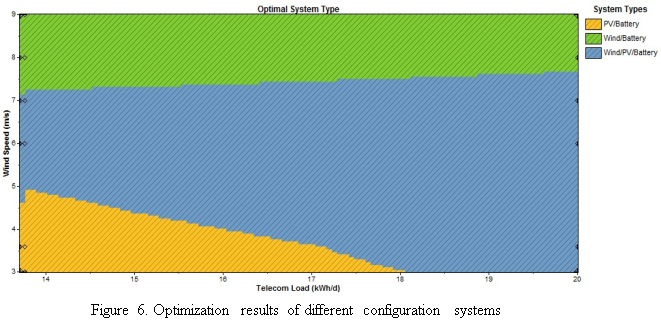
The daily telecom load profile is shown in figure (5). Figure (6) shows the optimization results of different configuration systems for varying wind speed and telecommunication load of existing system. From the figure (5) it is clear that only 6.12 kW KC85T PV system cannot meet the telecommunication load demand. The figure delineates that if the wind speed is below 4.5 m/s, only PV system is applicable to the telecom load upto 750Watt. Similarly, if the wind speed is above 7 m/s, only wind system is feasible for the all the load demand. However, most feasible configuration of the system is categorized by hybrid system consisting wind turbine and the PV array.
The simulation result shows that Hummer H3.1 (1kWx2) wind turbine, Trina Solar TSM-175DA01 (8.05kW) PV array and Trojan T-105 (1125Ah) justified the remote telecom load requirement of Dadakhara with reliability of 99.99 % with a significant cost reduction as well as reliable energy production in the proposed system. On the contrary, the existing system containing Hummer H3.1 (1kW) wind turbine, Kyocera KC85T (6.12kW) PV array and Narada GFM-800 (1600Ah) have an unmet load of 36.6 % during a year. The results can be analyzed in terms of excess energy, reliability and LUEC from different manufacturer specifications. Figure (7) delineates the reliability and excess energy as a function of Trina Solar TSM-175DA01 power with Trojan T-195 (1125Ah) battery capacity for a different wind turbine. It can be observed from figure (5) that Hummer H3.1 has a better reliability than BWCXL 100 and Kestrel 1000 each of 1 kW capacity. From the figure it is clear that Kestrel 1000 (two 1kW capacity) has a less excess energy than rest of the system, however, the reliability of it is similar to the 1kW Hummer H3.1 wind turbine. The figure shows that Hummer H3.1 two 1kW wind turbine has a higher reliability than rest of the system with excess energy higher than rest.
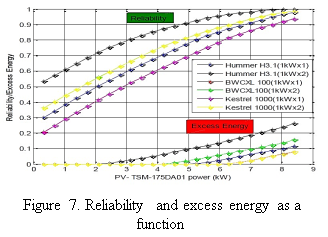
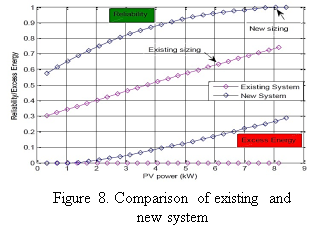
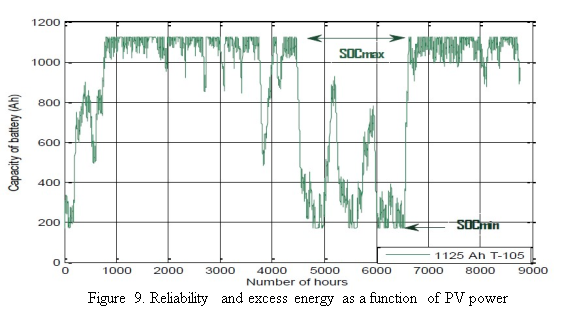
Figure (8) represents the comparison of the existing NT system and the proposed system. It illustrates that existing system has deficient energy to fulfill the remote telecom load. The reliability is also poor than the newly proposed system which has reliability of 99.99 % with excess energy of 26.9 % in a year. Figure (9) represents the hourly variation of state of charges of the battery T-105. The optimal configuration of the system consists of 40 batteries each of 225Ah with 5 battery bank in parallel resulting in a maximum capacity of 1125Ah in which remote telecom station load is always satisfied.
The simulation results shows that net present cost of existing and new system is $101,550 and $72,378. Similarly, The LUEC from the existing system is $1.22 and the proposed system is $0.88.
Conclusion
Our study focused on designing a model that would allow us to find the optimal system design parameters of a hybrid solar-wind system, taking into consideration the number of solar arrays and wind turbines, as well as the wind turbine rotor diameter and height. The objective was to meet the load of different applications using our designed hybrid system, while minimizing costs. Using generated weather data typical of Middle Eastern deserts, our model had to test the for the presence of a potential complementary relationship between wind and solar energy systems under similar weather conditions. Many different applications were considered, and the optimal design parameters for each application were found, meaning the optimum number of solar arrays and wind turbines, as well as the optimum rotor diameter and height. After the tests were carried out, a complementary relationship between both individual systems was visible in our results. In summertime, when solar radiation is abundant and there is little wind energy, the solar arrays supply most of the required energy. In wintertime, when wind velocities are higher and there is less solar radiation, it is the wind turbines that supply most of the required energy, thus providing clear evidence of a complementary relationship between the two sources.
References:
- Joanne Hui, Alireza Bakhshai, and Praveen K. Jain, “A Hybrid Wind-Solar Energy System: A New Rectifier Stage Topology,” IEEE Conference, February 2010.
- C. L. Smallwood, “Distributed generation in autonomous and nonautonomous microgrid,” in Proc. 2015 IEEE Rural Elect. Power Conf, pp.1–6
- Energy Information and Administration, (01.05.2009), http://www.eia.doe.gov
- Walker, G., “Evaluating MPPT Converter Topologies Using A Matlab PV Model”, Journal of Electrical & Electronics Engineering, 21(1), 2016 pp. 49–50
- A.McEvoy, T.Markvart, and L. Castaner, Practical Handbook of hotovoltaics: Fundamentals and Applications, Academic Press, Amsterdam, The Netherlands, 2012.
- C. Luis and S. Silvester, Modeling Photovoltaic Systems Using Pspice, JohnWiley & Sons, 2002.
- A. D. Hansen, P. Sorensen, L. H. Hansen, and H. Binder, “Models for a stand-alone PV system,” Tech. Rep., RisøNational Laboratory, Roskilde, Denmark, 2001.
- N. A. Orlando, M. Liserre, V. G.Monopoli, R. A.Mastromauro, and A. Del’Aquila, “Comparison of power converter topologies for permanent magnet small wind turbine system,” in Proceedings of the IEEE International Symposium on Industrial Electronics (ISIE ’08), pp. 2359–2364, July 2008.
- A. B. Cultura and Z. M. Salameh, “Modeling and simulation of a wind turbine-generator system,” in Power and Energy Society General Meeting, IEEE, 2011.
- Subodh Paudel, MSc Thesis, 2011, “Optimization of Hybrid PV/Wind Power System for Remote Telecom Station”, Institute of Engineering, Pulchowk Campus, Nepal.
- M. Gengaraj, J. Jasper Gnanachandran, “Modeling of a standalone photovoltaic system with charge controller for battery energy storage system,” International Journal of Electrical Engineering, vol.6, no. 3, 2013.
- Mihnea Rosu-Hamzescu, Sergiu Oprea, “Practical guide to implementing Solar panel MPPT algorithm,” Microchip technology Inc, 2015.
