


Portfolio manager in the preparation of the investment portfolio is guided by certain strategies. These strategies are defined algorithms for selection of securities. In developing these algorithms certain risk and profit parameters are established. Throughout the entire period of stock market, operation there is a constant evolution of the investment strategies. Consider «Global Macro» strategy, which analyzes movement of global trends of economic development.
During market’s high efficiency the probability of obtaining profit over the market is reduced to zero. For manager in Kazakhstan drawing fully copying stock index portfolio is quite problematic task as this approach considers a significant transaction costs. Another problem with the fully copying index would be a significant cost of generated portfolio as most global indices have more than 30 securities [1, p. 26].
Let us try to develop an algorithm for compiling a portfolio based on copying the most profitable global indices without depending on specific markets and with a lower risk of the high return rate. This approach will also significantly reduce the number of portfolio’s securities. All of it will make it much more effective than the existing index funds and more affordable for domestic investor. It will also allow to achieve the core idea of the «Global Macro» strategy such as trapping the overall global trends of economic development.
The analysis of a list of the most profitable global indices and economies is made according to the developed algorithm for start the drawing of a portfolio of securities based on «Global Macro» strategy and copying of indices. In order to do this dynamics and total return (profitability) are tracked over 5 years. For instance [2].
Table 1
Total return of the most effective indices, in%
|
Indices |
2009–2015 (six years) |
|
MICEX (ММВБ) |
28,57 |
|
Nifty 50 |
52,78 |
|
Bel 20 |
47,33 |
|
DAX |
80,33 |
|
Dow 30 |
67,10 |
This list of indices consist of the following indices: MICEX (ММВБ) — the Russian index, calculated as an average of capitalization of 50 most liquid (marketable) companies; Nifty 50 — Indian market index, calculated based on the 50 largest companies listed on the Brussels Stock Exchange; DAX — Germany’s defining index; Dow 30 — the main stock index of the industrial development of America.
From these indices allocation of shares (stocks) is made corresponding to the dynamics defining their development indices. In addition, with relevant or more low-risk distributed under the optimum weights for the best achievement of these indicators in the major factor is determined by the time of optimization.
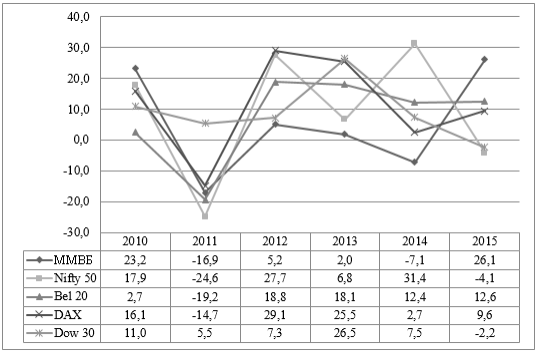
Picture 1. Dynamics of the most profitable global indices
The above diagram presents the profitability (return) of the selected indices in dynamics over six years.
The first step for direct selection of components was to determine the expected return and risk of each index for subsequent comparison of similar parameters of its components [3].
Table 2
Indices’ indicators of risk and expected return, in%
|
Indices |
Country |
Risk level of index,% |
Expected return of index,% |
|
MICEX (ММВБ) |
Russia |
5,34 |
8,38 |
|
Nifty 50 |
India |
3,9 |
10,83 |
|
Bel 20 |
Belgium |
3,5 |
14,18 |
|
DAX |
Germany |
4,66 |
12,74 |
|
Dow 30 |
USA |
3,14 |
10,11 |
The average expected return of five indices is 11, 24 %, the average risk level is 4,1 %. In order to compare the risk and return analysis of Kazakhstani index was conducted. As a result of this analysis the conclusion can be made about the unacceptability of investing in Kazakhstan’s stock market using the method of portfolio development based on «Global Macro» strategy. The «Global Macro» strategy is supposed to capture with the help of indices of economic development trends. Kazakhstan’s stock index demonstrate reduction dictated by the uncertainty in the economy [4].
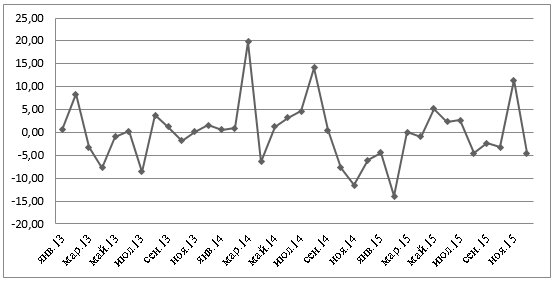
Picture 2. KASE index dynamics
According to Diagram 2 the return of Kazakhstan’s index demonstrates periods of stagnation changing to periods of the sharp rise and fall.
Table 3
Risk and return of KASE index
|
Index |
Risk level,% |
Expected return,% |
Total return over 3 years,% |
|
KASE |
6,70 |
-2,01 |
-6,02 |
According to Table 3, it is seen that expected return, as well as total return over three years, has negative value. In addition, the risk level value is important, 6,70 %. Despite that, Kazakhstan’s index might be an ideal object of investing as while purchasing its components there is no significant transaction costs. Due to data from analysis, Kazakhstan’s index was not selected to include to the portfolio.
After calculations of expected return and standard deviation of each stock in index four most similar ones can be highlighted with parent index of securities. The main criteria of selection were the following: similarity or lower risk level characterized by standard deviation; similar or highest profitability; sufficient correlation with index higher than 0, 75. Finally, each index should meet or exceed its sample of four stocks (shares).
Selecting securities according to these criteria the following results were achieved:
Table 4
Comparison of copied samples and index, in%
|
Index |
Risk, in% |
Expected return, in% |
Returnin 2013–2015, in% |
Correlation |
|
DAX sample |
3,71 |
11,5 |
53,37 |
0,80 |
|
DAX |
4,66 |
12,8 |
38,34 |
|
|
Dow 30 sample |
3,47 |
8,2 |
31,43 |
0,79 |
|
Dow 30 |
3,14 |
10,5 |
30,35 |
|
|
MICEX (ММВБ)sample |
3,15 |
10,0 |
42,72 |
0,71 |
|
MICEX (ММВБ) |
5,34 |
8,4 |
25,14 |
|
|
Bel 20 sample |
2,58 |
13,2 |
42,30 |
0,73 |
|
Bel 20 |
3,50 |
14,2 |
42,56 |
|
|
Nifty 50 sample |
3,97 |
9,6 |
38,86 |
0,87 |
|
Nifty 50 |
3,92 |
10,8 |
32,48 |
In the calculation of five indices 20 components of the index portfolio are obtained, which are assigned to certain shares in the portfolio. This share distribution serves as a tool of optimization of return and risk of the individual components.
By combining and arranging components of developed portfolio in comprehensive portfolio of copied indices the following final values were obtained [5]:
Table 5
Portfolio final values, in%
|
Portfolio risk level, in % |
2,08 |
|
Portfolio expected return, in % |
13,91 |
|
Portfolio total return, in % |
41,73 |
In addition, given the risks and weighted average index orientation each security in portfolio is assigned to certain weight.
Components of designed portfolio have the following price values. Due to that portfolio has securities from different countries it was agreed to count the cost of them according to January 2016 US dollar exchange rate.
Table 6
Price values of stocks in portfolio
|
Company name |
Cost of share in the local currency dated 01.01.2016 |
US dollar exchange rate dated 01.01.2016 |
Cost of shares in US dollars |
|
Transneft |
189200 |
0,0133 |
2516,36 |
|
NOVATEK |
639,2 |
8,50 |
|
|
CHERKIZOVO Group |
1091 |
14,51 |
|
|
Gazprom |
136,6 |
1,82 |
|
|
ITC |
320,2 |
0,0147 |
4,71 |
|
HDFC Bank |
1049,85 |
15,43 |
|
|
Kotak Mahindra |
683,6 |
10,05 |
|
|
Power Grid Corp |
147,85 |
2,17 |
|
|
Ackermans en van Haaren |
119,45 |
1,0837 |
129,45 |
|
Ageas SA |
37,345 |
40,47 |
|
|
Elia System Op. |
44,5 |
48,22 |
|
|
GBL |
69,87 |
75,72 |
|
|
Munchener Ruck |
176,85 |
191,65 |
|
|
Deutsche Borse |
78,61 |
85,19 |
|
|
Fresenius Medical |
81,67 |
88,51 |
|
|
Fresenius |
60,94 |
66,04 |
|
|
J&J |
104,44 |
1 |
104,44 |
|
McDonald's |
123,78 |
123,78 |
|
|
Coca-Cola |
42,92 |
42,92 |
|
|
Procter&Gamble |
81,69 |
81,69 |
If to sum prices of all shares in portfolio it results to value of 3651, 13 US dollars which can be accepted as the minimum threshold. However, due to the different proportions of shares in the portfolio it is recommended to use the minimum amount of capital of 19000 US dollars [6].
As it was proven designed portfolio has a weak dependency on the global world indices, but it is able to demonstrate superior expected returns.
Table 7
Comparison of portfolio risk and return with global indices, in%
|
Indices |
Risk level,% |
Expected return,% |
Total return,% |
|
MSCI World |
3,16 |
7,83 |
23,49 |
|
FTSE World |
3,14 |
6,52 |
19,55 |
|
S&P Global 100 |
3,39 |
5,72 |
17,16 |
|
Portfolio |
2,08 |
13,91 |
41,74 |
As a result, designed portfolio by developed methodology has return (profitability) which seems to be significantly superior for analysis to existing analogues. Such return was obtained without adopting any additional risks. These risks were minimized by sampling the best components from various indices and assigning them certain weights. This risk in average 1,15 % lower than global indices’, which characterize development of stocks of global market. After testing this model of portfolio at the previous values obtained total return at the end of 2015 equals to 41.74 % despite the fact that the profitability of the most popular global index MSCI World is 23,49 %.
Designed portfolio, which is based on «Global Macro» strategy, considers the main development trends of global markets excluding possible effects of burdening unnecessary element indices. This will be conventionally called «assets with catching-up development». This circumstances allows to achieve a return of 13, 91 % for risks taken in 2,08 %. In the worst-case scenario it is possible to get 7, 67 % in US dollar currency.
This portfolio is based on «Global macro» strategy defined as the most effective in accordance with the world practice. Designed portfolio based on «Global Macro» strategy obtained return of 13, 91 %, which is approximately, doubled the average values of profitability of the market at lower risk of 2, 08 %. This strategy considers the main impulses in the development of stock markets in five countries, but at the same time, after performing analytical work the levels of systematic and specific risks of composite components of portfolio are optimized.
References:
- А. Воронцовский. Современные теории рынка капитала: Учебник. — Санкт-Петербург: издательство «Экономика», 2010.
- Website Agency for Research of investment funds. — http:// www.eurekahedge.com/
- Forex for beginners. — http://www.investing.com /
- The official website of the Kazakhstan Stock Exchange — http://www.kase.kz/
- The site of the analytical agency Russell — http:// www.russell.com/
- Information portal about personal finance and investments — http://www.investfunds.kz/
