


Russian Tourist Market, a Development Perspective for Albania as a Destination

Автор: Zoto Stella Nikita
Рубрика: 18. Туризм
Опубликовано в
II международная научная конференция «Экономическая наука и практика» (Чита, февраль 2013)
Статья просмотрена: 128 раз
Библиографическое описание:
Zoto, Stella Nikita. Russian Tourist Market, a Development Perspective for Albania as a Destination / Stella Nikita Zoto. — Текст : непосредственный // Экономическая наука и практика : материалы II Междунар. науч. конф. (г. Чита, февраль 2013 г.). — Т. 0. — Чита : Издательство Молодой ученый, 2013. — С. 96-100. — URL: https://moluch.ru/conf/econ/archive/75/3420/ (дата обращения: 21.09.2024).
According Gravity Model (Matias, 2004; Dubarry, 2000), LINNEMANN (1966),the tourist flow between two countries depends on three categories of factors; driving factors (the origin), attractive (the destination) and resistance factors (individual among an origin and a specific destination).
In this context, we see the development of tourist flows between Russia and Albania, and will try to make some interpretations about the market share occupied by Russian tourist flows and the growth of these flows in Albania.
It will also make an exploration of Russian touristic demand in origin, so what are the major destinations for Russian tourists, the main motives of Russian tourists travel, and finally will try to give some idea of the importance of this market in the future for Albanian.
Keywords: gravity model, touristic flows, touristic demand, market sharew, growth rate.
Theoretical framework
According Gravity Model (Matias, 2004; Dubarry, 2000) and later LINNEMANN (1966), the demand between two countries for tourism depends on three categories of factors; driving factors (of the origin), attractive (of the destination) and the resistance factors (individually between an origin and a specific destination)
Push factors, sometimes called “diffusers” factors, are the characteristics of a population in a market that encourages origin travel.
Push factors (the origin)
a. Size of population
b. GDP (gross domestic) and revenue trends
c. Distribution of income
d. Distribution of education
e. Distribution of age
f. Time for fun
g. Family structure
h. Momentum (inertia)
Pull factors (destination)
a. Friends / relatives
b. Climate / weather
c. Commercial links
d. The social / cultural
e. Destination marketing programs
f. Distribution channels
g. Attractive destination
h. Special events
i. Additional destinations
j. Habits
3. Resistant factors
a. Prices
i.The price of the product (products)
ii. Prices of substitutes
iii. Prices of participants
iv. Needs prices
v. Exchange rate
vi. Taxes and fees
b. Actions of competitors
c. Supply capacity
d. Distance
e. Travel time
f. Place of origin where exchange shall be carried out
g. Border controls, customs and other border formalities
h. Taxes arrival / departure and terminal fees
i. War / terrorism / crime / social unrest
j. Natural and man-made disasters
k. Physical obstacles
Figure 1; Potential explanatory variables in a regression model to forecast tourism demands
For example, if everything else is equal, a large population of a region will generate more trips than a smaller population.
Momentum-boost, push, “mobility” force, refers to the effects of custom, recommendations of friends or relatives, institutional relations and other factors that may trigger the requirements of a certain origin.
Pull factors are those factors that attract visitors to a destination to impose. Visits to friends and relatives is a primary motivation for visiting that has for purpose entertainment, and cities that have mostly ethnic populations may especially benefit from this type of travel. Commercial incloude presence of major offices of large corporates in destination, or having a concentration of financial or manufacturing firms. The social / cultural ties might include ethnic neighborhood or particular institutions, cultural centers, religious sites, museums and monuments. Religious similarities between the two countries may also be a strong influence to carry travel between them. Such other factors include the similarity of language and presence in a state (country) in a population with residents of another state (country)
Stable factors (resistance) include those factors that bind to travel between the country of origin i and a destination j. For example price is a modifier of resistance, because more powerful travelers have limited incomes, especially in relation to their everyday and long-term needs. From this point of view we will try to explain tourism flows originating from the Russian Federation addressed to Albania.
Russian tourist demand.
Arrivals chart shows that in 1999 in Albania have been 269 people (tourists), while in 2010 about 5660 Russians have crossed the Albanian, an increase of approximately 20 times. Most remarkable periods of development of the application have been in 2001 with a very large drop in demand (in my thorough later I corrected the value), the year 2006 with an increase greater than 2 times the previous year, 2007 with a very large increase, followed by a significant decrease in the years 2008–2009. Arrivals peak reached in 2008 with about 7331 tourists. Albania abolished the visa regime in the summer season in the years 2010–2012. For this reason, the number of Russian tourists in Albania has increased. But here we must clarify one point. These are not direct tourists, in the sense of coming directly from Russia to Albania. They transit through Albania. Of the total of 5,600 tourists, 90 percent come from Montenegro, Greece or Macedonia. The average 1999–2010 annual arrivals, is 2430 tourists / year.

Graphic 1. The number of russian tourists coming in Albania 1999–2000.
Market share chart shows a very large increase of Russian market share of the total in 2007, from 0.18 % to 0.59 %. Continues to remain high for 2008 up to 0.5 %, but falls in 2009 and 2010 at 0.2–0.3 %. Average market share for these 10 years is 0.2 %. Peak is reached in 2007 by approximately 0.6 %. This shows that in this period the Russian touristic demand for Albania has increased faster than that average foreign demand for tourism in Albania. However, as long as the average market share for the 10-year is higher than the initial market (1999), means that Russian tourist demand for Albania is growing rapidly.

Graphic 2. The share of russian touristic demand of the total of touristic demand.
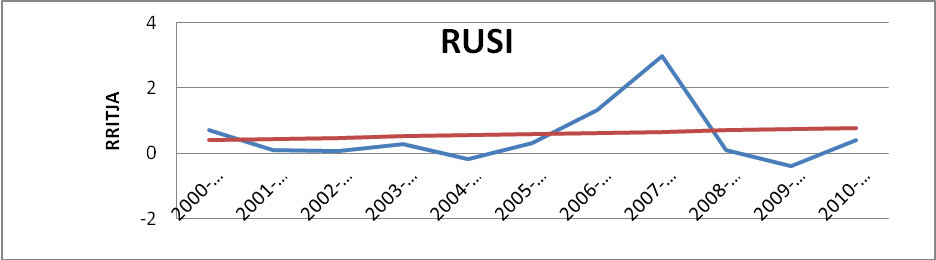
Growth chart shows two periods of declining demand: a very large decline in 2001 from -100 % drop in 2004 with -25 % in 2009 to -50 % decline. Growth rate for 2003 is positive (25 %), in 2005 approximately 50 %, for 2006 there is an excess demand almost 3 times compared with a year ago, (extreme value) which does not change for 2007–2008 (0 % growth pattern).

Graphic 3. The growth rate of Russian touristic demand between the period 1999–2010.
Russian federation has an average increase of 61.2 %, this is very good value, and a deviation of ± 91.4 %, a bad value. When compared with all other origins Russia ranks third in terms of average annual growth of tourist arrivals after Slovakia and Kosovo, leaving behind many other major origins that are closer in terms of geography, but has a very large fluctuated growth which makes it difficult to forecast arrivals for future periods.
Graphic 4. Trend of long-term growth of touristic demand for the period 1999–2010.
Long-term growth trend is positive (as shown in the chart) with slope coefficient 0.037 ≥ 0. It is ranked sixth in terms of the slope coefficient of growth, after Kosovo, Ukraine, and Croatia, but passes countries like Romania, Greece, Serbia, France or Bosnia and Herzegovina
|
VENDI |
MESATARJA |
DISPERSIONI |
VENDI |
b0 |
|
Malta |
1.24453084 |
6.247080896 |
Kosovo |
0.655368 |
|
Slovakia |
0.887172592 |
1.615696338 |
Malta |
0.177994 |
|
Kosovo |
0.70896073 |
0.171848064 |
Ukraine |
0.056018 |
|
Russian Federation |
0.612427125 |
0.914046897 |
Croatia |
0.046224 |
|
Poland |
0.5300764 |
0.129559052 |
Israel |
0.045317 |
|
Czech Republic |
0.402494364 |
0.152462949 |
Russian Federation |
0.037313 |
|
Croatia |
0.384758562 |
0.091058367 |
Japan |
0.024288 |
|
Bosnia and Herzegovina |
0.363364495 |
0.085270746 |
Romania |
0.021588 |
|
Israel |
0.35179 |
0.133535883 |
Greece |
0.020935 |
|
Korea, Republic of |
0.326933375 |
0.086275149 |
Serbia |
0.020935 |
|
China |
0.311660775 |
0.249393225 |
France |
0.02061 |
|
Ukraine |
0.305110724 |
0.989166917 |
Bosnia and Herzegovina |
0.01902 |
|
Slovenia |
0.3016549 |
0.111153292 |
Denmark |
0.016717 |
|
Finland |
0.298267203 |
0.124437853 |
Turkey |
0.016561 |
|
Romania |
0.288687365 |
0.038973015 |
Germany |
0.016429 |
|
Canada |
0.28746578 |
0.02051933 |
Slovenia |
0.015092 |
|
Hungary |
0.268882741 |
0.032762708 |
Spain |
0.014692 |
|
Switzerland |
0.266074308 |
0.081925929 |
Italy |
0.012576 |
|
Sweden |
0.257950709 |
0.04355457 |
Korea, Republic of |
0.011517 |
|
Belgium |
0.252019932 |
0.035410199 |
Bulgaria |
0.011137 |
|
Austria |
0.238861053 |
0.036420959 |
Switzerland |
0.010515 |
|
Australia |
0.23376011 |
0.054457369 |
Norway |
0.009613 |
|
Norway |
0.193480095 |
0.046235932 |
TFYR of Macedonia |
0.001611 |
|
United Kingdom |
0.186222379 |
0.028283763 |
Sweden |
-0.00673 |
|
Ireland |
0.182028588 |
0.023308277 |
Austria |
-0.00741 |
|
Netherlands |
0.179466574 |
0.023037031 |
United States of America |
-0.01125 |
|
Spain |
0.175758306 |
0.015856167 |
Ireland |
-0.01765 |
|
United States of America |
0.16313412 |
0.016705895 |
Belgium |
-0.01791 |
|
TFYR of Macedonia |
0.160376624 |
0.040236792 |
Finland |
-0.01889 |
|
Greece |
0.154851438 |
0.016443786 |
United Kingdom |
-0.01894 |
|
Germany |
0.154814078 |
0.006674737 |
Australia |
-0.01941 |
|
Turkey |
0.150959135 |
0.03676285 |
Netherlands |
-0.01993 |
|
France |
0.144378079 |
0.029598691 |
Canada |
-0.02324 |
|
Bulgaria |
0.129055652 |
0.039998044 |
Hungary |
-0.02363 |
|
Japan |
0.116265899 |
0.003636186 |
Poland |
-0.04619 |
|
Italy |
0.109524434 |
0.006567243 |
China |
-0.05297 |
|
Denmark |
0.085647151 |
0.052326801 |
Czech Republic |
-0.05867 |
|
Montenegro |
0.05686619 |
0.005123911 |
Montenegro |
-0.08692 |
|
Serbia |
-0.08541451 |
0.029007615 |
Slovakia |
-0.10925 |
Russia has a coefficient of seasonality 2.39 in the peak period (the period from July to September), in the period April-June the coefficient is 0.84, in the October-December period it is 0.42 in the period from January to March it is 0.25. 3-month arrivals chart, shows that there is a regular seasonality, but the amplitude of change is not the same. There has been a constant and steady coefficient peak in years and drop all other coefficients, which shows a concentration of demand for peak period. This shows that Albania is increasingly being seen by Russian travelers as a vacation destination for sun and sea, or other activities in the spring-summer period. I think this relates to the way Russian tourists travel abroad boundaries. It is more a characteristic of push factors that appealing factors.
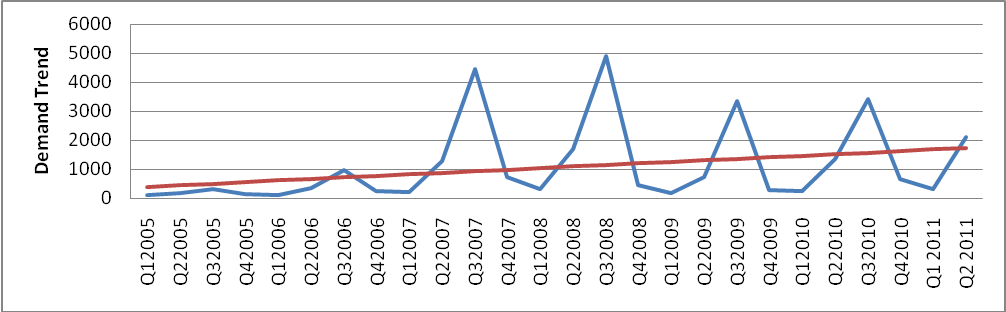
Graphic 4. 3-months demand of Russian touris for Albania. The period belongs to january 2005-june 2011.
Russia is seen as a market with great potential size of the market itself, and relative proximity to Albania. However, unfortunately, still there is not a direct air line between Tirana and Moscow. Operation of such a line depends on the number of tourists and businessmen. Albanian tourism firms have been present in Russia, but the process is moving very slowly. As users are operators, so that they are more Russian tourists will pour into Albania.
Favorite international destinations for Russians:
Ukrain _21 % of international departures, Finland _9 %, Kazakhstan_8 %, Turkey _8 %
China_ 6 %, Egypt 4_ %, Estonia _4 %, Other _41 %.
Albania itself can compete against competitors in the region (Greece, Montenegro, Croatia, Italy, Turkey) for Eastern European origins through the low-price strategy, improving the quality of existing services. This is true for sun and sea tourism. According to tour operators, Turkey's main competitors, which are attracting more and more tourists, Thailand, Spain and Greece. «Especially in our region, many countries are giving their strong support to the tourism sector, reducing prices. And from countries such as Russia, tourists prefer more and more countries, «More than 50 % of Russian tourists seeking tour packages very cheap prices. Although bookings of visitors from Russia in various agencies has increased by 20 % since 2010, earnings have dropped by 25 % because agencies packs sold were those lower prices. Another advantage for the Russian market is the practice of winter sports as tourists being recognized more and more as tourists you like adventures. Their favorite destinations remain unspoilt exotic places and not very populated with respect to nature. While there remain behind and preferences for nightlife and clubs. Also do not forget the cultural and economic relations 50–60 years, and a similar historical experience of communism. All these elements make the Russian market a very promising market for Albania as a destination.
Referncat:
Anderson, P. S. (1979). A Theoretical foundation for the gravity equation. American Economic Review, 69: 106–116
Dubarry R. (2000). Tourism expenditure in the UK: Analysis of competitiveness using a Gravity-Based Model. Tourism & Trade Research Institute, Discussion paper 2000/1, University of Nottingham.
Head, K. (2003). Gravity for beginners. Working Paper. University of British Columbia
Linnemann, H. (1966). An econometric study of international trade flows. Amsterdam: North-Holland Pub. Co.
Martinez-Zarzoso, I., Nowak-Lehmann, F. (2003). Augmented Gravity Model: an empirical application to Mercosur-European trade flows. Journal of Applied Economics, VI (2): 291–316
Matias A. (2004). Economic Geography, Gravity and Tourism Trade: the case of Portugal. In Brebbia C. A., Wessex Institute of Technology, United Kingdom & F. D. PINEDA, Complutense Univerisity (eds).
Rose, A. (2002). Do we really know that the WTO increases trade. NBER Working Paper N. 9273
Serlenga, L., Shin, Y. (2004). Gravity Models of intra-EU trade: application of the Hausman-Taylor estimation in heterogeneous panels with common time-specific factors. Edinburgh School of Economics Discussion Paper, n. 88, University of Edinburgh
Tinbergen, J. (1962). Shaping the World Economy: Suggestions for an international economic policy. New York, The Twentieth Century Fund