


According Gravity Model (Matias, 2004; Dubarry, 2000), Linnemann (1966), the tourist flow between two countries depends on three categories of factors; driving factors (the origin), attractive (the destination) and resistance factors (individual among an origin and a specific destination). In this context, we see the development of tourist flows between Russia and Albania, and will try to make some interpretations about the market share occupied by Russian tourist flows and the growth of these flows in Albania. It will also make an exploration of Russian touristic demand in origin, so what are the major destinations for Russian tourists, the main motives of Russian tourists travel, and finally will try to give some idea of the importance of this market in the future for Albanian.
Key words: gravity model, touristic flows, touristic demand, market sharew, growth rate.
1.Theoretical framework
According Gravity Model (Matias, 2004; Dubarry, 2000) and latter linnemann (1966), the demand between two countries for tourism depends on three categories of factors; driving factors ( of the origin), attractive (of the destination) and the resistance factors (individually between an origin and a specific destination)
Push factors, sometimes called “diffusers” factors, are the characteristics of a population in a market that encourages origin travel.
Push factors (the origin)
Size of population
GDP (gross domestic) and revenue trends
Distribution of income
Distribution of education
Distribution of age
Time for fun
Family structure
Momentum (inertia)
Pull factors (destination)
Friends / relatives
Climate / weather
Commercial links
The social / cultural
Destination marketing programs
Distribution channels
Attractive destination
Special events
Additional destinations
Habits
Resistant factors
a. Prices
The price of the product (products)
Prices of substitutes
Prices of participants
Needs prices
Exchange rate
Taxes and fees
b. Actions of competitors
c. Supply capacity
d. Distance
e. Travel time
f. Place of origin where exchange shall be carried out
g. Border controls, customs and other border formalities
h. Taxes arrival / departure and terminal fees
i. War / terrorism / crime / social unrest
j. Natural and man-made disasters
k. Physical obstacles
Figure
I.
Potential
explanatory
variables
in
a
regression
model
to
forecast
tourism
demands
For
example, if everything
else is
equal, a
large
population of
a
region
will
generate
more trips
than
a
smaller
population.
Momentum-boost,
push, “mobility”
force,
refers
to
the
effects
of
custom,
recommendations
of
friends
or relatives,
institutional
relations
and
other factors
that may
trigger
the
requirements of a
certain
origin.
Pull factors are those factors that attract visitors to a destination to impose. Visits to friends and relatives is a primary motivation for visiting that has for purpose entertainment, and cities that have mostly ethnic populations may especially benefit from this type of travel. Commercial include presence of major offices of large corporate in destination, or having a concentration of financial or manufacturing firms. The social / cultural ties might include ethnic neighborhood or particular institutions, cultural centers, religious sites, museums and monuments. Religious similarities between the two countries may also be a strong influence to carry travel between them. Such other factors include the similarity of language and presence in a state (country) in a population with residents of another state (country)
Stable factors (resistance) include those factors that bind to travel between the country of origin i and a destination j. For example price is a modifier of resistance, because more powerful travelers have limited incomes, especially in relation to their everyday and long-term needs. From this point of view we will try to explain tourism flows originating from the Bulgaria addressed to Albania.
Methodology
The methodology is based on secondary data collection and processing. There are assembled time series of annual arrivals during 1999-2010 period and quarterly arrivals series during 2005-2010 period. The market share is calculated as the ratio of total annual Bulgarian arrivals. The growth rate is calculated as a percentage of current arrivals to an earlier period. While the growth trend is calculated as a simple regression equation coefficient depending on time period. Seasonality coefficient is calculated as a component of seasonality, in the decomposition model.
Bulgarian touristic demand
Graph of the demand for Bulgaria is showing a decline until 2003, following from a growth. Average tourist arrivals from the year 1999 to 2010 is 7,849 tourists / year in 2010 compared with 7305 tourists / year for the period from 1999 to 2009. The average number of arrivals per capita is 0.001 tourists.
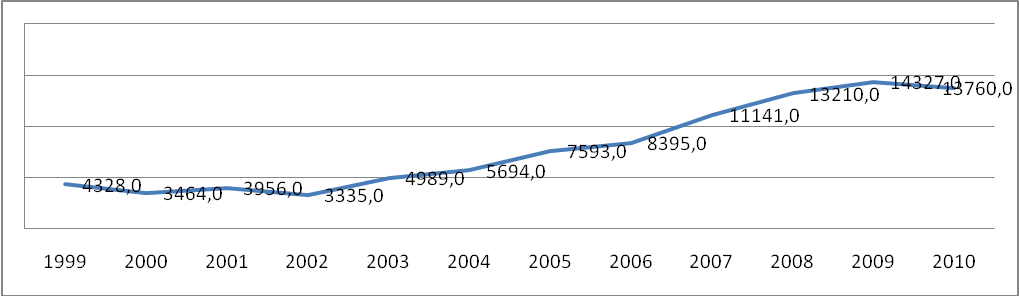
Graphic I. The number of Bulgarian tourists coming in Albania during 1999-2000
Market share chart shows a continuous fluctuation margins 0.56% (2010) to 1.2% (1999). In general, we can say that market share has fallen. Market share (on average) is 0.92% in 2010 compared to 0.96% in 2009 (-0.04%)

Graphic II. The share of Bulgarian touristic demand from the total of touristic demand
Growth chart, shows
a decrease in
2000
(-20%)
and
in
2002
(-10%),
the maximum
increase
in
2003
by 50%,
growing
smaller
below.
Feature is
the regular
cycle
of
ups and downs
of growth
pattern.
In the 2010
it is noticed
a decreased
(-0.4%).
Average
/ year
of growth
during the period of 1999-2010
were
12.9%,
with a
deviation of
±
3.9%,
an increase
comparable to
France.
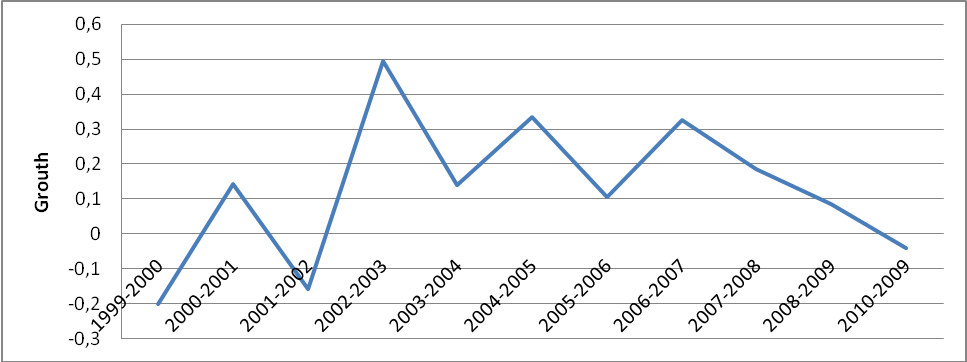
Graphic III. The growth rate of Bulgarian touristic demand between the period 1999-2010
Bulgaria has a growing rhythm that changes almost in a cyclical way. There is a positive trend and the growth rate is 0.011.
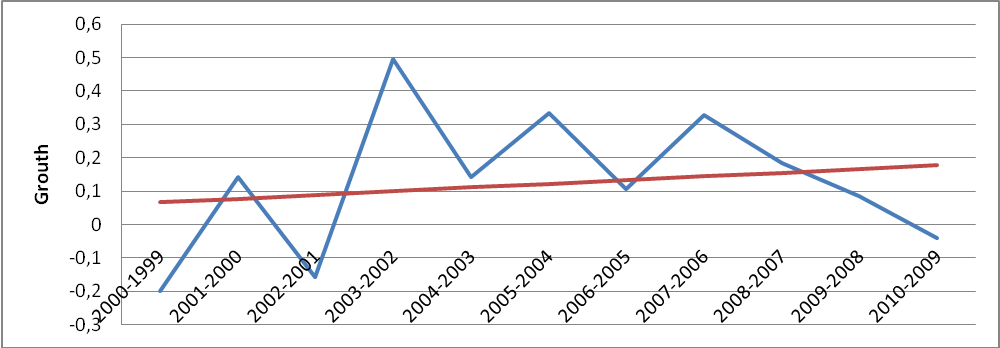
Graphic IV. Trend of long-term growth of touristic demand for the period 1999-2010
Bulgaria has a peak period during July-September, with the coefficient of 1.3, the period from April to June it has a 1.1 coefficient, October-December period it has the coefficient of 0.9, and the period from January to March (the period of decline) with the coefficient of 0.7. Bulgarian touristic demand is not seasonal. This means that it is mainly a business tourism, and other minor fluctuations are due to reasons such as extreme sports tourism, transit, (the tourists who go to Greece but who want to travel to see all Riviera (Mediterranean coast), as well as tourism remains attributed to friends and family. Bulgarian demand is more seasonal compared to Turkey. This is because the Turkish request is made only for business and family relationships. While in the case of Bulgaria it is a small part coming for tourism genuine. This is because Bulgaria is closer, and those who love special interest tourism can use Albania as a destination. Also take advantage from transit flows to Greece. Average three monthly demand is 2896 tourists/quarterly, and the tendency of demand is 83.5(the rhythm of growth of the growth).
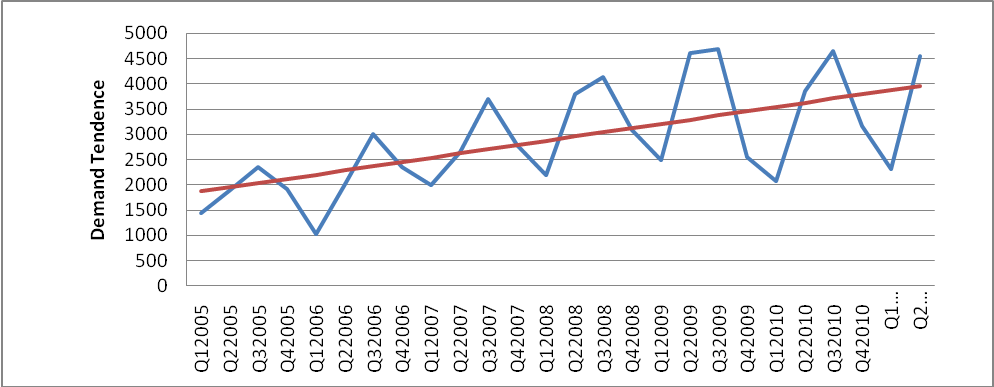
Graphic V. 3-months demand of Bulgarian tourists for Albania. The period belongs to January 2005-june2011
Bulgaria ranks 13 on average arrivals / year, and 10th place for the number of tourists / residents.
Table I
Ranking of countries of origin according to the annual average growth for the period 1999-2010
|
COUNTRY |
AVERAGE |
DISPERSSION |
b0 |
a0 |
|
Malta |
1.24453084 |
6.247080896 |
0.177994 |
0.06977 |
|
Slovakia |
0.887172592 |
1.615696338 |
-0.10925 |
1.608218 |
|
Kosovo |
0.70896073 |
0.171848064 |
0.655368 |
-0.60177 |
|
Russian Federation |
0.612427125 |
0.914046897 |
0.037313 |
0.366162 |
|
Poland |
0.5300764 |
0.129559052 |
-0.04619 |
0.834933 |
|
Czech Republic |
0.402494364 |
0.152462949 |
-0.05867 |
0.789747 |
|
Croatia |
0.384758562 |
0.091058367 |
0.046224 |
0.079678 |
|
Bosnia and Herzegovina |
0.363364495 |
0.085270746 |
0.01902 |
0.237834 |
|
Israel |
0.35179 |
0.133535883 |
0.045317 |
0.052695 |
|
Korea, Republic of |
0.326933375 |
0.086275149 |
0.011517 |
0.263589 |
|
China |
0.311660775 |
0.249393225 |
-0.05297 |
0.661235 |
|
Ukraine |
0.305110724 |
0.989166917 |
0.056018 |
-0.06461 |
|
Slovenia |
0.3016549 |
0.111153292 |
0.015092 |
0.202051 |
|
Finland |
0.298267203 |
0.124437853 |
-0.01889 |
0.422966 |
|
Romania |
0.288687365 |
0.038973015 |
0.021588 |
0.146203 |
|
Canada |
0.28746578 |
0.02051933 |
-0.02324 |
0.440819 |
|
Hungary |
0.268882741 |
0.032762708 |
-0.02363 |
0.424827 |
|
Switzerland |
0.266074308 |
0.081925929 |
0.010515 |
0.196676 |
|
Sweden |
0.257950709 |
0.04355457 |
-0.00673 |
0.302365 |
|
Belgium |
0.252019932 |
0.035410199 |
-0.01791 |
0.370209 |
|
Austria |
0.238861053 |
0.036420959 |
-0.00741 |
0.287782 |
|
Australia |
0.23376011 |
0.054457369 |
-0.01941 |
0.361839 |
|
Norway |
0.193480095 |
0.046235932 |
0.009613 |
0.130032 |
|
United Kingdom |
0.186222379 |
0.028283763 |
-0.01894 |
0.310553 |
|
Ireland |
0.182028588 |
0.023308277 |
-0.01765 |
0.29854 |
|
Netherlands |
0.179466574 |
0.023037031 |
-0.01993 |
0.311022 |
|
Spain |
0.175758306 |
0.015856167 |
0.014692 |
0.078789 |
|
United States of America |
0.16313412 |
0.016705895 |
-0.01125 |
0.237404 |
|
TFYR of Macedonia |
0.160376624 |
0.040236792 |
0.001611 |
0.149746 |
|
Greece |
0.154851438 |
0.016443786 |
0.020935 |
0.016677 |
|
Germany |
0.154814078 |
0.006674737 |
0.016429 |
0.046386 |
|
Turkey |
0.150959135 |
0.03676285 |
0.016561 |
0.041659 |
|
France |
0.144378079 |
0.029598691 |
0.02061 |
0.00835 |
|
Bulgaria |
0.129055652 |
0.039998044 |
0.011137 |
0.055553 |
|
Japan |
0.116265899 |
0.003636186 |
0.024288 |
-0.04403 |
|
Italy |
0.109524434 |
0.006567243 |
0.012576 |
0.026522 |
|
Denmark |
0.085647151 |
0.052326801 |
0.016717 |
-0.02469 |
|
Montenegro |
0.05686619 |
0.005123911 |
-0.08692 |
0.230697 |
|
Serbia |
-0.08541451 |
0.029007615 |
0.020935 |
0.016677 |
Table II
Ranking of countries according to the coefficient of the tendency of growth for the period 1999-2010
|
COUNTRY |
b0 |
|
Kosovo |
0.655368 |
|
Malta |
0.177994 |
|
Ukraine |
0.056018 |
|
Croatia |
0.046224 |
|
Israel |
0.045317 |
|
Russian Federation |
0.037313 |
|
Japan |
0.024288 |
|
Romania |
0.021588 |
|
Greece |
0.020935 |
|
Serbia |
0.020935 |
|
France |
0.02061 |
|
Bosnia and Herzegovina |
0.01902 |
|
Denmark |
0.016717 |
|
Turkey |
0.016561 |
|
Germany |
0.016429 |
|
Slovenia |
0.015092 |
|
Spain |
0.014692 |
|
Italy |
0.012576 |
|
Korea, Republic of |
0.011517 |
|
Bulgaria |
0.011137 |
|
Switzerland |
0.010515 |
|
Norway |
0.009613 |
|
TFYR of Macedonia |
0.001611 |
|
Sweden |
-0.00673 |
|
Austria |
-0.00741 |
|
United States of America |
-0.01125 |
|
Ireland |
-0.01765 |
|
Belgium |
-0.01791 |
|
Finland |
-0.01889 |
|
United Kingdom |
-0.01894 |
|
Australia |
-0.01941 |
|
Netherlands |
-0.01993 |
|
Canada |
-0.02324 |
|
Hungary |
-0.02363 |
|
Poland |
-0.04619 |
|
China |
-0.05297 |
|
Czech Republic |
-0.05867 |
|
Montenegro |
-0.08692 |
|
Slovakia |
-0.10925 |
This in terms of arrivals in Albania but let's see what type of tourists are Bulgarians; following conclusions have emerged from the study "Flash EB No 291– Survey on the attitudes of Europeans towards tourism, wave 2”
Table III
European Community countries as potential demand for tourism outside the European community
|
nr |
COUNTRY |
|
EU |
|
NON EU |
Potencial |
|
1 |
GERMANY |
81802257 |
EU |
26994745 |
NON EU |
6544181 |
|
2 |
POLONI |
38167329 |
EU |
5725099 |
NON EU |
1526693 |
|
3 |
SPAIN |
45989016 |
EU |
6438462 |
NON EU |
1379670 |
|
4 |
CHECK REPUBLIK |
10506813 |
EU |
3782453 |
NON EU |
1260818 |
|
5 |
NETHERLANDS |
16574989 |
EU |
6795745 |
NON EU |
1160249 |
|
6 |
FRANCE |
64716310 |
EU |
7765957 |
NON EU |
970744.7 |
|
7 |
SLOVAKIA |
5424925 |
EU |
1790225 |
NON EU |
922237.3 |
|
8 |
TURKY |
72561312 |
EU |
2902452 |
NON EU |
725613.1 |
|
9 |
SLOVENIA |
2046976 |
EU |
184227.8 |
NON EU |
655032.3 |
|
10 |
BELGIUM |
10839905 |
EU |
4769558 |
NON EU |
650394.3 |
|
11 |
HUNGARY |
10143324 |
EU |
1521499 |
NON EU |
608599.4 |
|
12 |
SWEDEN |
9340682 |
EU |
2241764 |
NON EU |
560440.9 |
|
13 |
NORWAY |
4858199 |
EU |
1457460 |
NON EU |
437237.9 |
|
14 |
ROMANIA |
21461186 |
EU |
4721461 |
NON EU |
429223.7 |
|
15 |
BULGARY |
10839905 |
EU |
975591.5 |
NON EU |
325197.2 |
|
16 |
FINLAND |
5351427 |
EU |
1070285 |
NON EU |
321085.6 |
|
17 |
DENMARK |
5529449 |
EU |
2101191 |
NON EU |
276472.5 |
|
18 |
UNITED KINGDOM |
62026962 |
EU |
|
NON EU |
248107.8 |
|
19 |
PORTUGALY |
10637713 |
EU |
1276526 |
NON EU |
212754.3 |
|
20 |
LITHUANI |
3329039 |
EU |
1797681 |
NON EU |
199742.3 |
|
21 |
CROATIA |
4415747 |
EU |
44157.47 |
NON EU |
176629.9 |
|
22 |
IRELAND |
4467854 |
EU |
1965856 |
NON EU |
134035.6 |
|
23 |
AUSTRI |
8375290 |
EU |
2763846 |
NON EU |
83752.9 |
|
24 |
ESTONI |
1340127 |
EU |
415439.4 |
NON EU |
80407.62 |
|
25 |
ITALY |
60340328 |
EU |
|
NON EU |
60340.33 |
|
26 |
MACEDONIA |
2052722 |
|
|
NON EU |
32843.55 |
|
27 |
LUKSEMBURG |
502066 |
EU |
276136.3 |
NON EU |
30123.96 |
|
28 |
MALTA |
414372 |
EU |
240335.8 |
NON EU |
16574.88 |
|
29 |
CYPRO |
803147 |
EU |
401573.5 |
NON EU |
16062.94 |
|
30 |
ISLAND |
317630 |
EU |
85760.1 |
NON EU |
15881.5 |
|
31 |
GREECE |
11305118 |
|
|
NON EU |
11305.12 |
Bulgarians travel trends
Top of Form
Bulgarians make more short trips than the European average.
Only 63% of Bulgarians do long vacation. They make long trips, less than an average European. Bulgarians like mostly passive vacations (more than the average for Europe), the sea and sun holidays also, like keeping themselves. But they like a few visits to cities, sports, getting acquainted with the culture of the country they visit. They are natural tourists 2 times more than an average European.
They do not travel a lot by plane (far less than the European average). This is for two major reasons; because it is expensive for them and they do not travel very far (2 major international destinations for Bulgaria are Turkey and Greece). Bulgarian tourists do not use at all water transport, but use a lot the railway transport, bus (3 times the European average), as well as they use a lot the car mode. They use bike mode, relatively a lot compared to Europeans. Bulgarians are trying to use cheaper forms of transport. Proximity addressed to Albania enables catching of this destination, with these forms of transportation.
77% of Bulgarians organize the journey by themselves (much more than the European average). While elements of travel or the entire journey, booked by travel agencies or on the internet, is made, far less than the European average. Unfortunately Bulgarian small percentage of the total population that has visited Albania makes it difficult for Bulgarians to capture it with this form. But an advantage for Albania is the fact that with Bulgaria has old historical connection (the common period in the communist bloc, as well as strong cultural exchanges of that period). Another element that should be mentioned are the exchange of students of that time, especially Albanian student who went to Bulgaria and some of them get married with Bulgarian girls, have created a specific market called 'visiting friends and family. "
49% of Bulgarians prefer traditional destinations, only 25% prefer emerging destinations (Albanian case), while 22% does not see this fact as an important fact. Approximately 50% of Bulgarians can see as a potential destination Albanian country.
Approximately 70% of Bulgarians are value oriented a value that is considerable. Albanian country can compete with Bulgarian country as a destination, only looking to provide a good product with good quality, which remains a challenge for Albania.
Approximately 70% of Bulgarians rely on personal sources and the recommendations of friends and companions searching information about the destinations. We cannot compete with the recently price with Turkey or Greece. But an important source, media, remains apparently high in decision-making weight (greater than the European average tourist). This means that we need to be present with reports on Albania country in the Bulgarian media. Bulgarians and Albanians have confidence in the media.
Attractions; Mainly want to perform outdoor activities you like entertainment (more than European average), they like cultural attractions (less than the European average).
This summer trips to other countries rose by 50 percent. Bulgarian tourists prefer charter flights and all-inclusive vacations. Increased market demand for vacation need much cheaper packets. This caused a significant decline in prices. Also began purchasing sites massive boom, where tour operators and hoteliers speculate with very cheap packages for marketing purpose.
Bulgaria has 2 main advantages in comparison with Albania. The first is the fact that Bulgaria itself has access to the sea, Black sea, with a beautiful coastline and very low prices, the lowest to Balkans. However a portion of the population travels outside Bulgaria, driven by the trend of change, to see something different.
Conclusions
On my opinion there are many strong and weak points of Albania against Bulgaria as origin: Bulgaria has a relatively large market for Albania, but with lower incomes than Western European countries. It has a bipolar distribution of income, but it has a new age population, and a great desire to rest, travel and entertain.
Albania on the other hand, is a destination for Bulgaria with many fascinating attractions, new places to be seen, natural resources, cultural and historical sites, with a warm Mediterranean climate, suitable for travel from April-November, with a very interesting story (with common period, Ottoman occupation and communist periods, but different in various forms) and a culture that arouse interest, similar in some respects to that of Bulgaria, but also very different in many other aspects. Unfortunately we have problems with the quality of our product (an infrastructure that leaves much to be desired, a not good quality service), distribution (Albania has not entered on the agenda of any major tour operator, and it cannot compete with the price to travel agencies in Bulgaria).
Prices are our biggest problem, because are high for a given quality. Our neighbors are our direct competitors, with a superior offer. An advantage for Albania is the short distance, but since travel is done mainly by car or bus it returns in a long journey. One possibility is that to extenuate the registration procedures and customs control at the border line. From my perspective Bulgarian interest market segments for Albania must be.
1. Youth and student Market. Young people require new experiences and tries to expand them borders. Albania appears a good alternative to prove himself, facing a challenge in a unknown place, but close and that does not require a high cost to capture.
2. The business market. It is currently the largest market that comes to Albania from Bulgaria. It is much important to convince the businessmen to return together with families and friends, this time for tourism.
3 .Visiting friends and relatives. For the reasons we mentioned above it is an important market for Albania. It is important to have a specific strategy to attract this market.
4. Transit market, that transit in Greece. They must return next time to visit Albania, or at least to stay a few days in the country.
For every each of this markets must be designed specific objectives and strategies in view of what we want to achieve.
Reference:
Anderson, P. S. (1979). A Theoretical foundation for the gravity equation. American Economic Review, 69: 106-116
Dubarry R. (2000). Tourism expenditure in the UK: Analysis of competitiveness using a Gravity-Based Model. Tourism & Trade Research Institute, Discussion paper 2000/1, University of Nottingham.
Head, K. (2003). Gravity for beginners. Working Paper. University of British Columbia
Linnemann, H. (1966). An econometric study of international trade flows. Amsterdam: North-Holland Pub. Co.
Martinez-Zarzoso, I., Nowak-Lehmann, F. (2003). Augmented Gravity Model: an empirical application to Mercosur-European trade flows. Journal of Applied Economics, VI (2): 291-316
Matias A. (2004). Economic Geography, Gravity and Tourism Trade: the case of Portugal. In Brebbia C. A., Wessex Institute of Technology, United Kingdom & F.D. PINEDA, Complutense Univerisity (eds). Sustainable tourism. Spain.
Rose, A. (2002). Do we really know that the WTO increases trade. NBER Working Paper N. 9273
Serlenga, L., Shin, Y. (2004). Gravity Models of intra-EU trade: application of the Hausman-Taylor estimation in heterogeneous panels with common time-specific factors. Edinburgh School of Economics Discussion Paper, n. 88, University of Edinburgh
Tinbergen, J. (1962). Shaping the World Economy: Suggestions for an international economic policy. New York, The Twentieth Century Fund