


Determination of optimum grain size fraction is critical in geochemical exploration of stream sediment. In arid area with various geological, and geomorphological conditions an orientation stream sediment geochemical survey was conducted in Wadi Haimur of southeastern Egypt in order to optimize grain size selection for recognize mineralization. Four selected grain size fractions, <63 µm, 63-250 µm, 250-500 µm, and 0.5-2 mm beside the bulk fraction (<2 mm) were analysed for their content of Au and associated trace elements using aqua regia method. All samples were analyzed for a variety of elements (19 elements) by AAS after the digestion. Element concentration levels of the data were the criteria for defining the best size fraction for each element. Based on element concentration levels and multiple regression analysis we can consider that 500-250 fraction is optimum size fraction for studying and detecting Au and its pathfinder elements within the study area. Both 2-0.5 mm and <63 µm fractions are suitable for transition and base metals whereas 250-63 µm found that it possibly be diluted by a wind blown dust. Also geochemical data on modem stream sediments in the Wadi Haimur basin were used to explore the role of grain-size differentiation on Au concentration.
Key words: Multiple regression analysis, stream sediment, arid, Egypt
The distribution of trace elements in different grain size fractions of stream sediments have very important aspect that needs special emphasis in geochemical exploration especially in Egypt whereas, geochemical patterns in stream sediments are affected by grain-size fraction [24, 20]. The selection of the optimum size fraction of a stream sediment sample provides the best opportunity for recognizing the presence of hidden mineralization within a catchment rea [1].
The climate, morphology and nature of sediments of the sampling area have a significant impact on the fractionation of sediments. Thus, recommended grain size of samples varies from fine [1; 13] to coarse [18], to material from which the fines were removed by sieving [5]. The coarse fractions of stream sediments are often used in arid areas because iron rich gossanous materials are more resistant to the breakdown in erosional processes. Hence the mechanical dispersion of such materials are more important than chemical dispersion in such environments [10, 14]. In other hand, coarse fractions may give less optimum results, if the anomalous signal is associated with either clay or hydrated Fe-Mn oxides or both. However, there is some evidence to suggest that the very fine fraction of stream sediments also possesses advantages in exploration for relatively mobile elements over the minus 200 µm fraction, which is the most commonly used fraction in humid climates [1]. He also had shown that in arid and semi-arid environments <70 µm fraction is advantageous in Cu, Pb, Zn, Mo and As mineralization due to the homogeneous population distribution, determination of threshold, contrast between anomalous and background populations and the length of dispersion trains. Further more minerals of hydrous oxides are known to be present in the finer fractions. Unfortunately, publications addressing this problem are rare, and the evidence from such surveys is somewhat contradictory. For example, at the Gamsberg zinc-lead deposit in South Africa, McLaurin [19] found similar lengths of dispersion in both the minus 70 µm and minus 200 µm fractions, whereas at the nearby Aggeneys lead-zinc-copper deposits [2] determined that the mineralization was better defined in the finer fraction.
The main purpose of this paper is to study grain size effect and estimate the optimum grain size fraction of Au and other analyzed elements in the selected grain size fractions of stream sediment samples.
Geological setting, geomorphology, and climate of the study area
Geologically, the studied area is covered by five distinct unit groups of Late-Proterozoic age (Fig. 2) including: i) Ophiolite group: this group comprises an association of intensely tectonised and altered basic to ultrabasic rocks dominated by serpentinite peridotite with relic tectonite fabric with calcite; magnesite and asbestos veins and various members of the classic ophiolite suite including cherts, pillow lavas, sheeted dikes, isotopic gabbro and layered gabbro with lesser volumes of meta-basalt and meta-andesite lavas. ii) Metavolcanics: The ophiolites are structurally overlain and partly imbricated with a series of weakly metamorphosed calc-alkaline basic to intermediate volcanics essentially formed of andesite, dacites and volcaniclastics of comparable composition; basalts and rhyodacites are subordinate while the true rhyolites are almost entirely absent [12]. iii) Granitoid rocks which are composed of granodiorite-tonalite rocks and metagabbro-diorite complex rocks; Plutonic rocks related to the island arc association are diorite, tonalite, the plutonic equivalent of island arc andesites and dacite as well as mantle derived gabbro [12]. iv) Metasedimentary rocks: of metapelitic and metapsammo-pelitic rocks. These units are cut by basaltic, andesitic and rhyolitic dykes, quartz veins and veinlets [8]. v) Quaternary deposits of Sand and gravel fill and terraces. The area was subjected to different tectonic deformational phases and traversed by igneous dykes and quartz veins. Major faults in the are running through the main Wadis such as Wadi Allaqi fault which has NW-SE direction and Wadi Haimur fault has a general trend NE-SE to ENE-WSW direction. The main gold mineralization around Haimur old mine is associated with quartz and quartz-carbonate viens and veinlets (striking N55° E and dipping 30° - 60° toward NW) along shear zone and- thrust fault plane [8]. The main Wadi and their tributaries and streams are filled with fragments of variable sizes ranging from clay fraction up to boulder sizes derived from the mentioned lithologic units and forming the sediments of the drainage basin in the area. The present investigations were carried out using stream sediment samples taken from the main Wadi Haimur and lateral streams (Fig. 1).
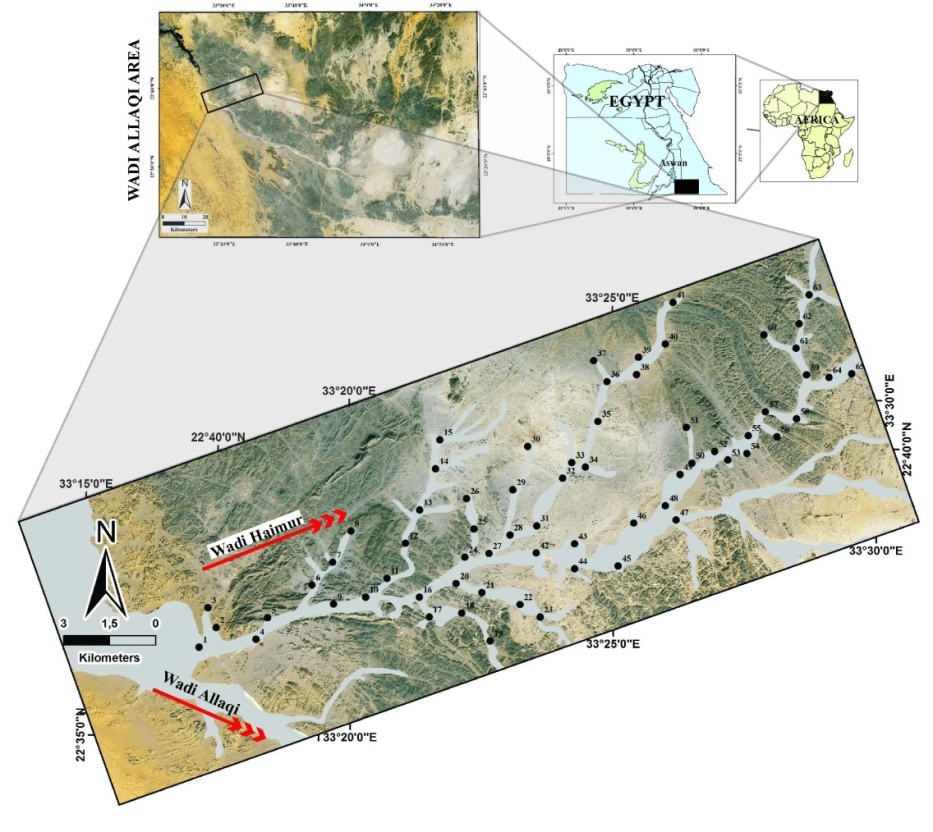
Fig. 1. Location map and stream sediment sampling stations in the study area
Geomorphologically it is characterized by positive topographic forms, including low to moderately high relief hills and mountains, the height of these mountains increases eastwards. The hills form ridge like shapes (trending NE-SW direction) to the east of Wadi Allaqi and north Wadi Haimur, and are composed of serpentinites, talc-carbonates and other rocks which attain 304m above sea level, and are known as Gebel Haimur. The area is traversed by the Wadi Allaqi, Wadi Haimur and their tributaries; all are structurally controlled with the main fault lines. The floors of the majority of Wadi Haimur and their tributaries are flat shaped and generally smooth and have gentle slopes. The tributaries vary in width from 40-160 m, the width of Wadi Haimur itself reach up to 280 m; all are filled with Quaternary sediments. These sediments consist mainly of mixture of mud, sands, gravels and boulders. So the soil was weakly developed in up-streams rather than in down-streams.
The present study was conducted in the Nubian desert of Egypt (Fig. 1) which is characterized as a “hyper-arid environment” with an aridity index of less than 0.05 in which the scarce rainfall usually leads to the formation of rare torrents pouring in the Wadis. These Wadis are filled with Quaternary sediments, and they incised in mountainous comprising igneous-metamorphic basement rocks of Precambrian age. Data from the nearest meteorological stations in Aswan show the annual mean temperature is 25.1 C. A mean minimum temperature of 8.1 C has been recorded for the month of January. However, it can be as low as -2 C (Wadi Allaqi records, January 1992).
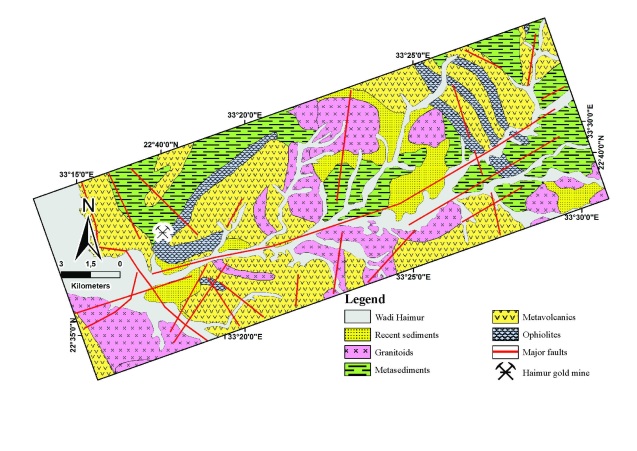
Fig. 2. Generalized geological map of the study area
Materials and Methods
Sampling and preparation of samples
A reconnaissance geochemical survey of Wadi Haimur area was based on a drainage survey (at one sample per 4 km2) supplemented by low-density stream sediment sampling. The elevations of the upstream and downstream sample sites are 250 and 190 m above sea level, respectively. For the stream sediment assessment and prospecting work, the main Wadi and its streams were selected to be sampled. .A 65 dry stream sediment samples of about 2-4 kg in size were collected from the preselected locations in the Wadi Haimur area (Fig.1). Samples were screened into four size fractions < 63 µm, 63-250 µm, 250-500 µm and 0.5-2 mm. Part of the samples were finely ground using an agate swing mill.
Sediment chemistry
The chemical analyses were carried out by an Atomic Absorption Spectrophotometry (AAS) technique. For Au and Ag, a 10 g subsample was digested with aqua regia at 95єC for 1 h in closed system, and then diluted to 25 ml with water. For other elements (As, Bi, Cu, Mo, Ni, Pb, Sb, Sn, W, Ba, Cr, Fe, Mn, Rb, Sr, Ti and Zn) 0.5 g subsample was digested with aqua regia at 95єC for 1 h, then diluted to 10 ml with water. The precision and accuracy of the preparation and the instrumental performances were checked using international reference sample, which are measured as `unknowns’ with, samples and sample duplicates.
Statistical treatment
Statistics is used to study the geochemical data distribution and to study relationships between the Wadi Haimur stream sediment contents. The software codes Microsoft® Excel, MINITAB® and STATISTIC® 8.0 for Windows were used for the statistical analysis. The univariate box plot (Figures 3 to 7) and multivariate data analysis (Table 2 and 3) of the Wadi Haimur streams geochemical dataset (19 elements) and particle size are calculated. Most statistical methods assume that observations are from a normally distributed population, but most geological data do not exhibit a normal distribution. Many geologic variables are positively skewed: lognormal or “fuzzy” distributions are often the norm in geological data [7, 23]; data assembled for this study are no exception. The statistical analyses showed that most element data, are positively skewed indicated in the summary statistics by the arithmetic mean > median in most cases (Figure 8) and a logarithmic (base 10) transformation were hence applied to normalize this effect. A logarithmic transformation is widely used to transform the positively skewed geological data into a more symmetrical form. The logarithmic transformation also tends to stabilize the variance of the data [9].
Results and discussion
The figures (3-7) show the centering dispersion of median, minimum, maximum, first quartile (Q1) and third quartile (Q3). Because a most of variables show positively skewed frequency distributions, transformation must have been carried out for most of the elements. However, in some cases (Ag for example in both 2-0.5 mm and <63 µm fractions) the results were poorer than original distributions. In such instances, the variables were left natural. Accordingly, due to the lognormal distribution of elements in geological materials [25, 22], in our study we take into consideration the median values (value at the 50th percentile) rather than mean values. In many cases, the regional distribution of elements is influenced by more than just one process/source, resulting in multi-modal skewed distributions. In this case the median, as a robust estimator of location, is far superior to the mean [21].
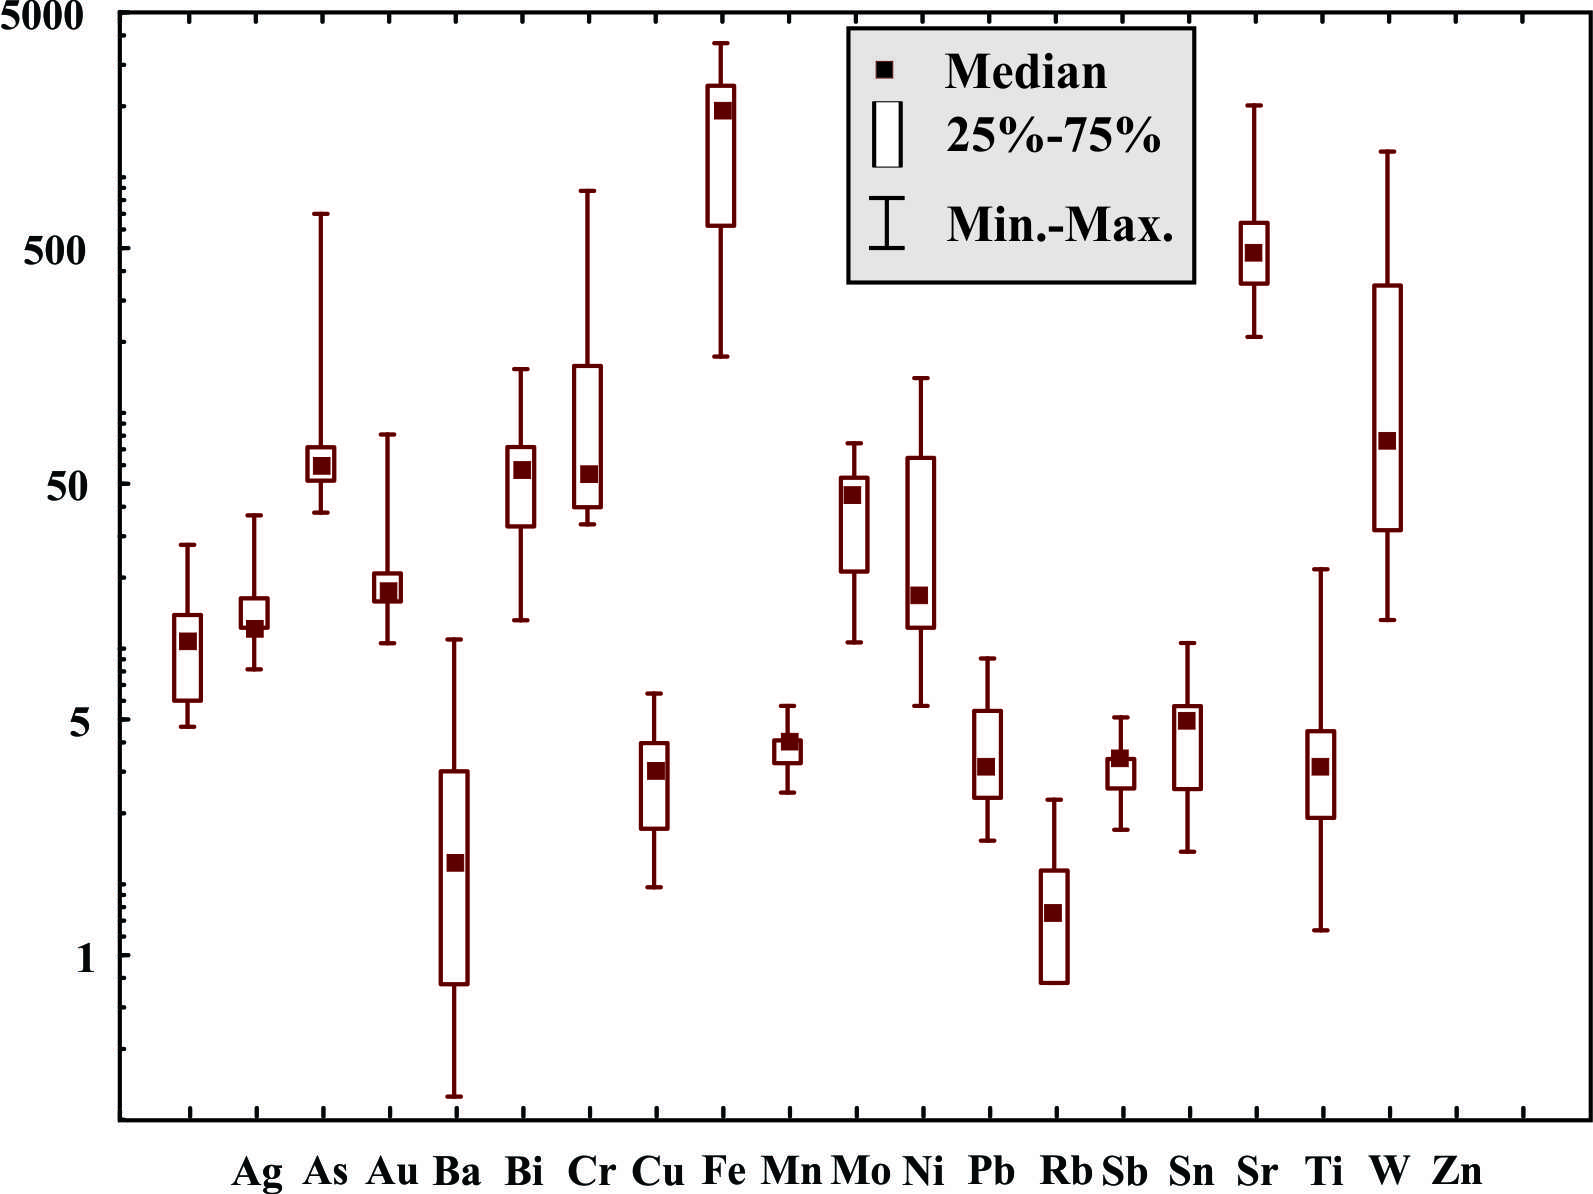
Fig.3. box-and-whisker diagram shows the minimum, lower quartile (Q1), median (Q2), upper quartile (Q3), and maximum values of 19 elements examined in the < 4 mm fraction of the Wadi Haimur stream sediments.
(All data in ppm except Ag and Au in ppb and Fe %)
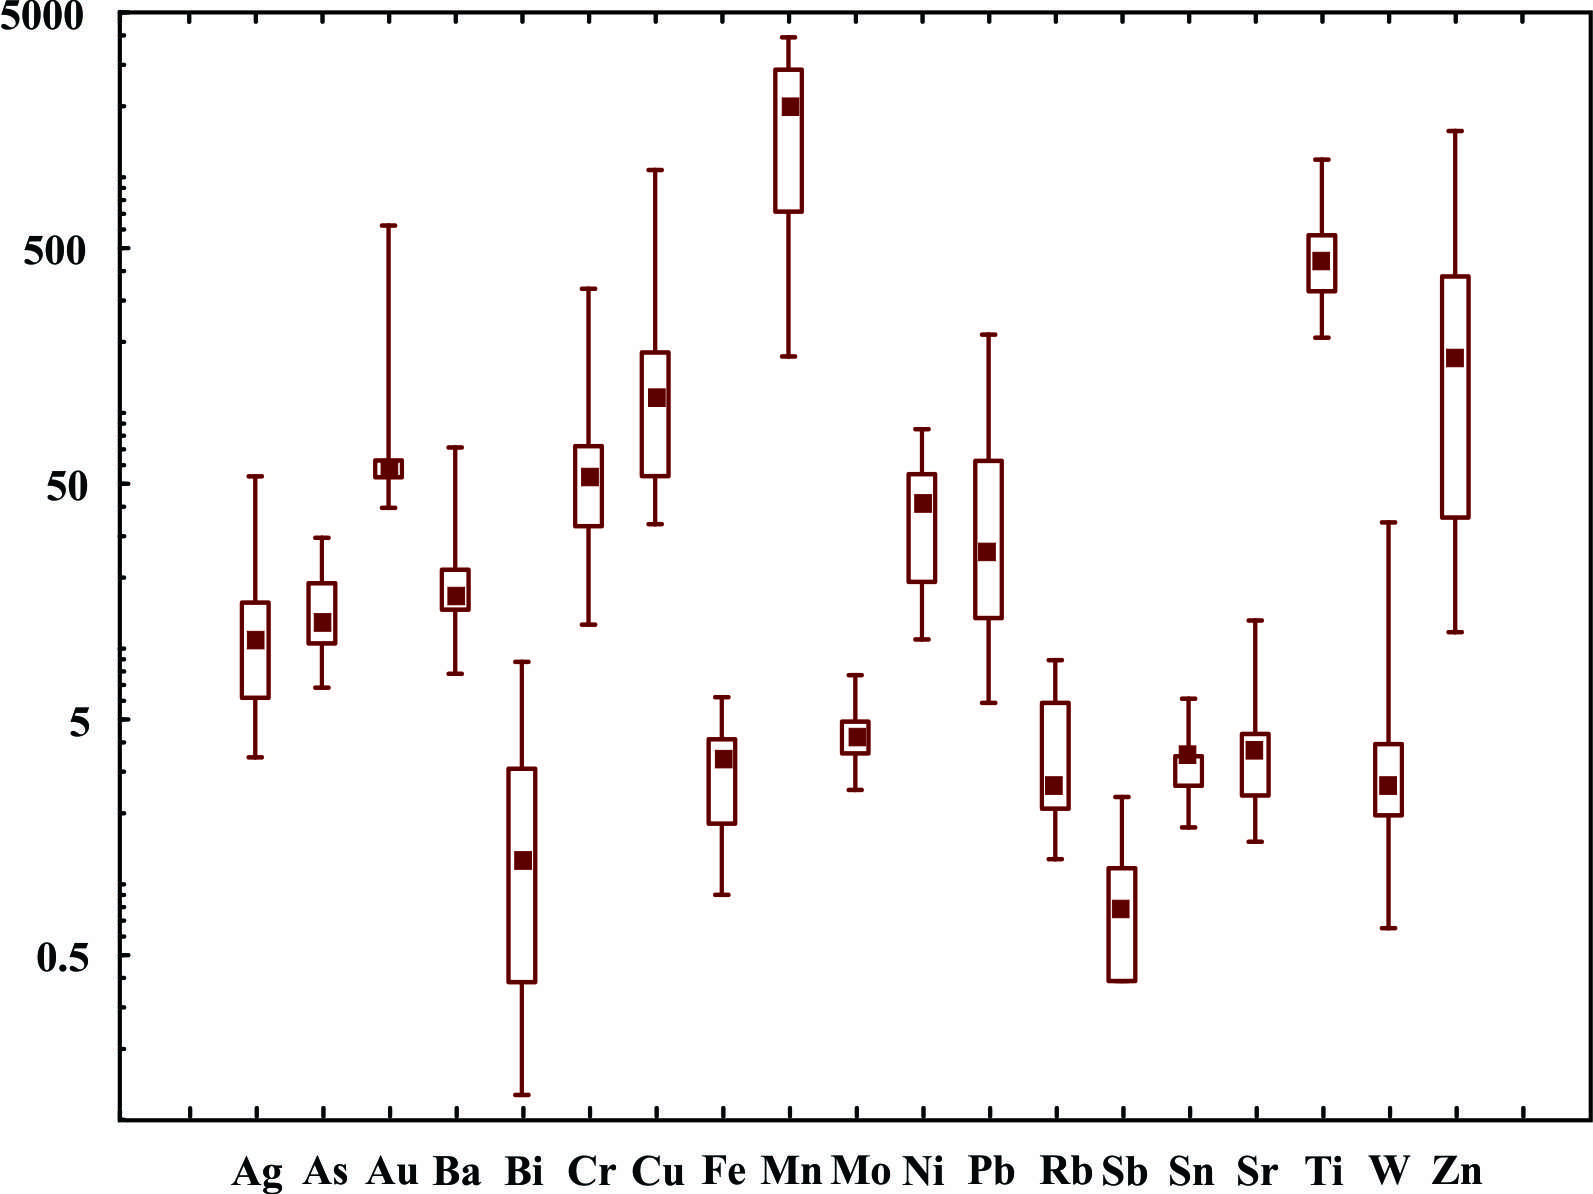
Fig.4.box-and-whisker diagram shows the minimum, lower quartile (Q1), median (Q2), upper quartile (Q3), and maximum values of 19 elements examined in the 2-0.5 mm fraction of the Wadi Haimur stream sediments.
(All data in ppm except Ag and Au in ppb and Fe %)
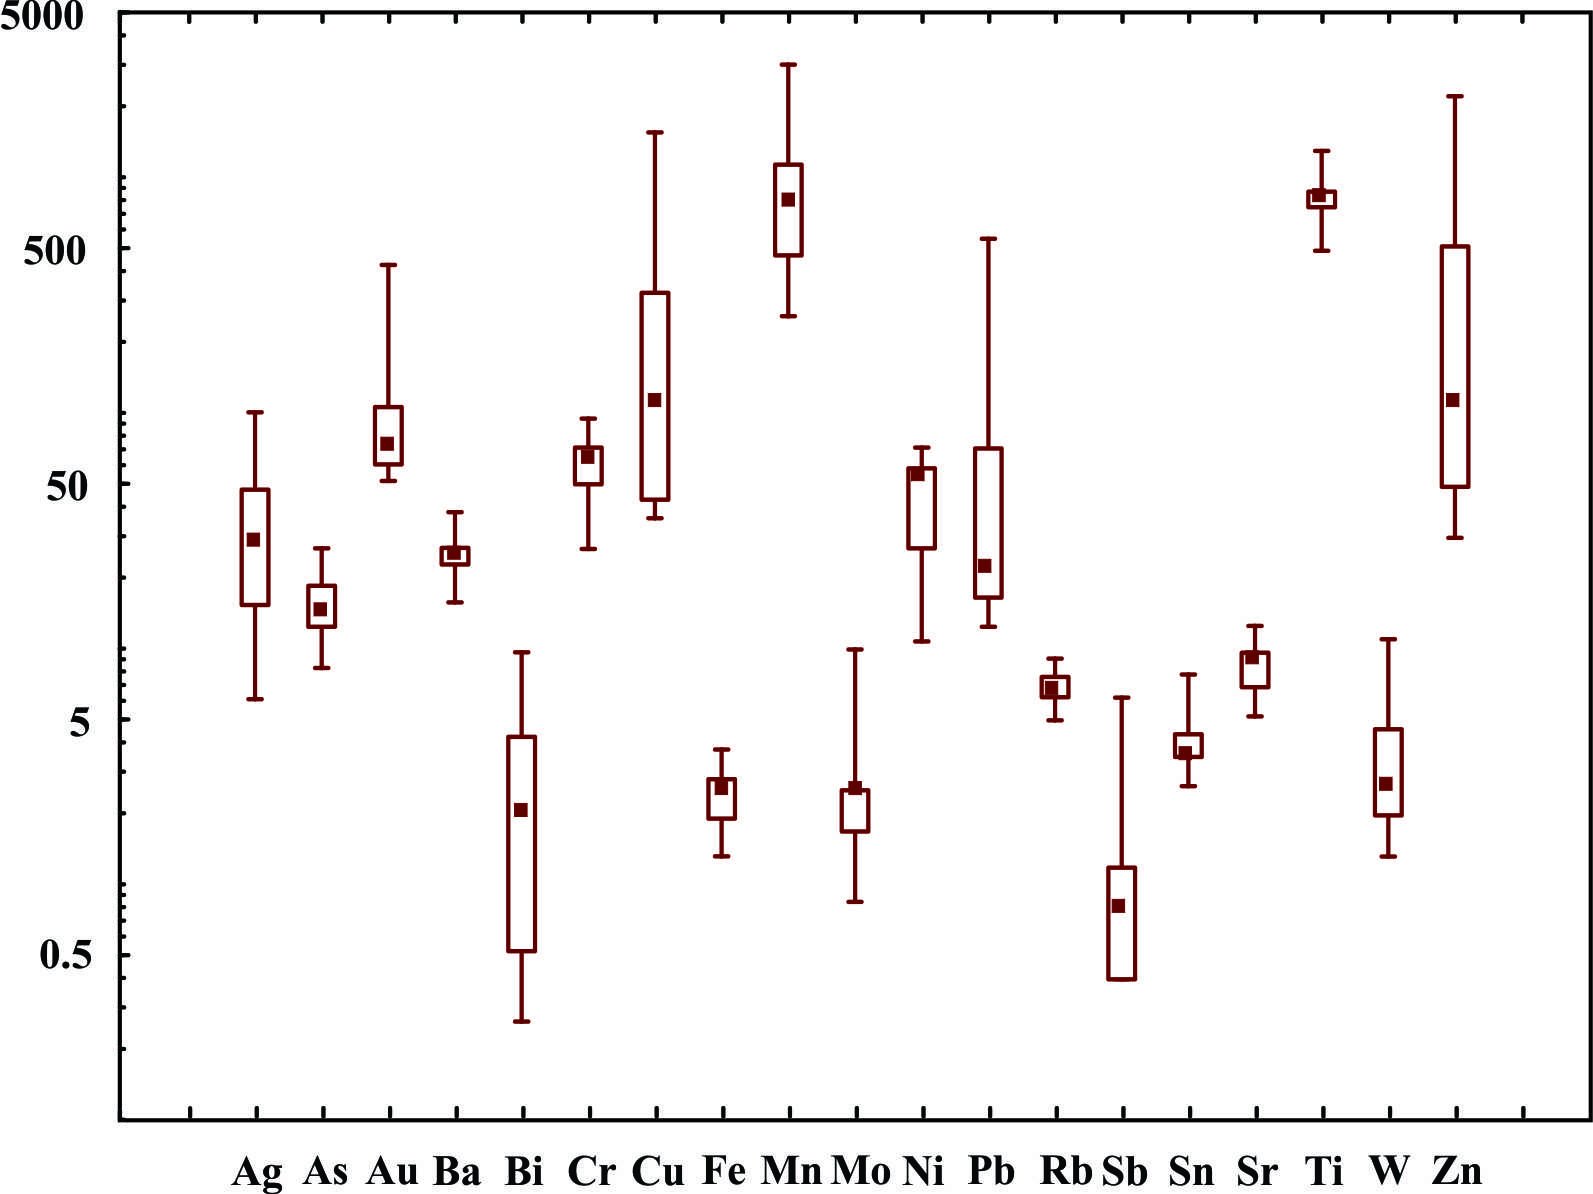
Fig.5.box-and-whisker diagram shows the minimum, lower quartile (Q1), median (Q2), upper quartile (Q3), and maximum values of 19 elements examined in the 500-250 µm fraction of the Wadi Haimur stream sediments.
(All data in ppm except Ag and Au in ppb and Fe %)
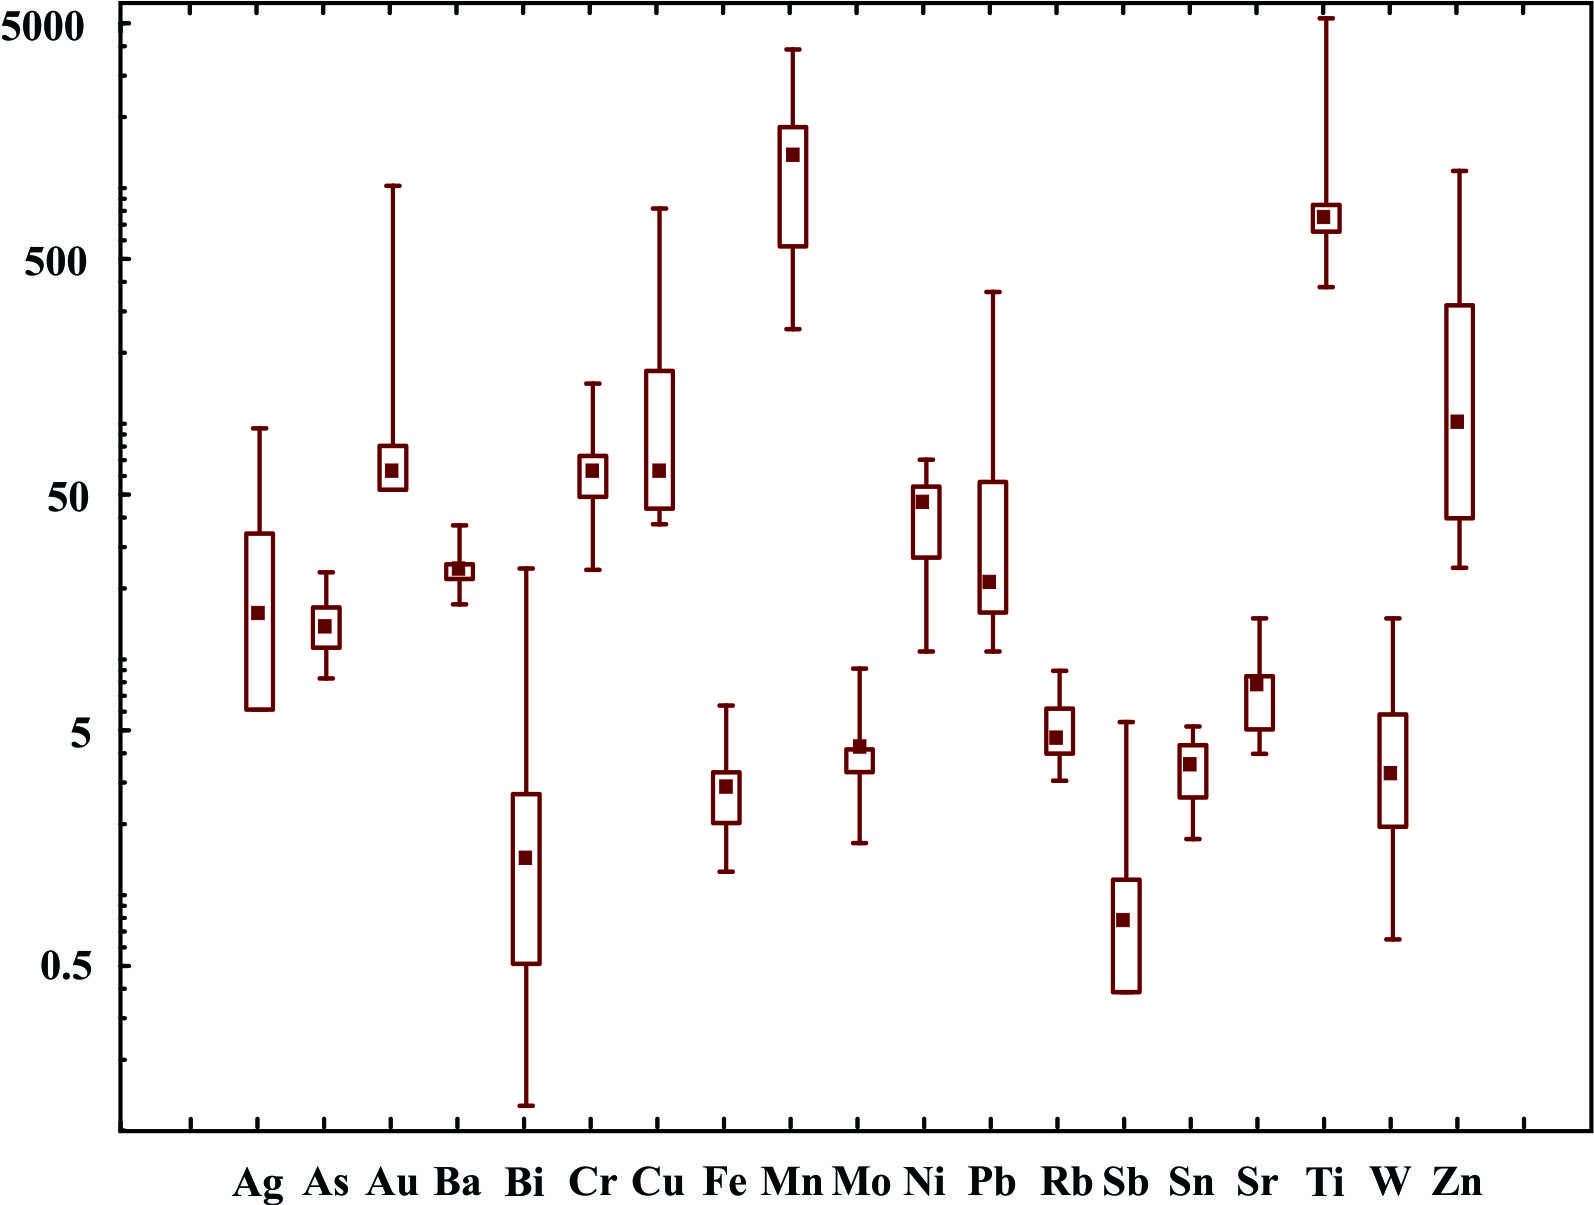
Fig.6.box-and-whisker diagram shows the minimum, lower quartile (Q1), median (Q2), upper quartile (Q3), and maximum values of 19 elements examined in the 250-63 µm fraction of the Wadi Haimur stream sediments.
(All data in ppm except Ag and Au in ppb and Fe %)
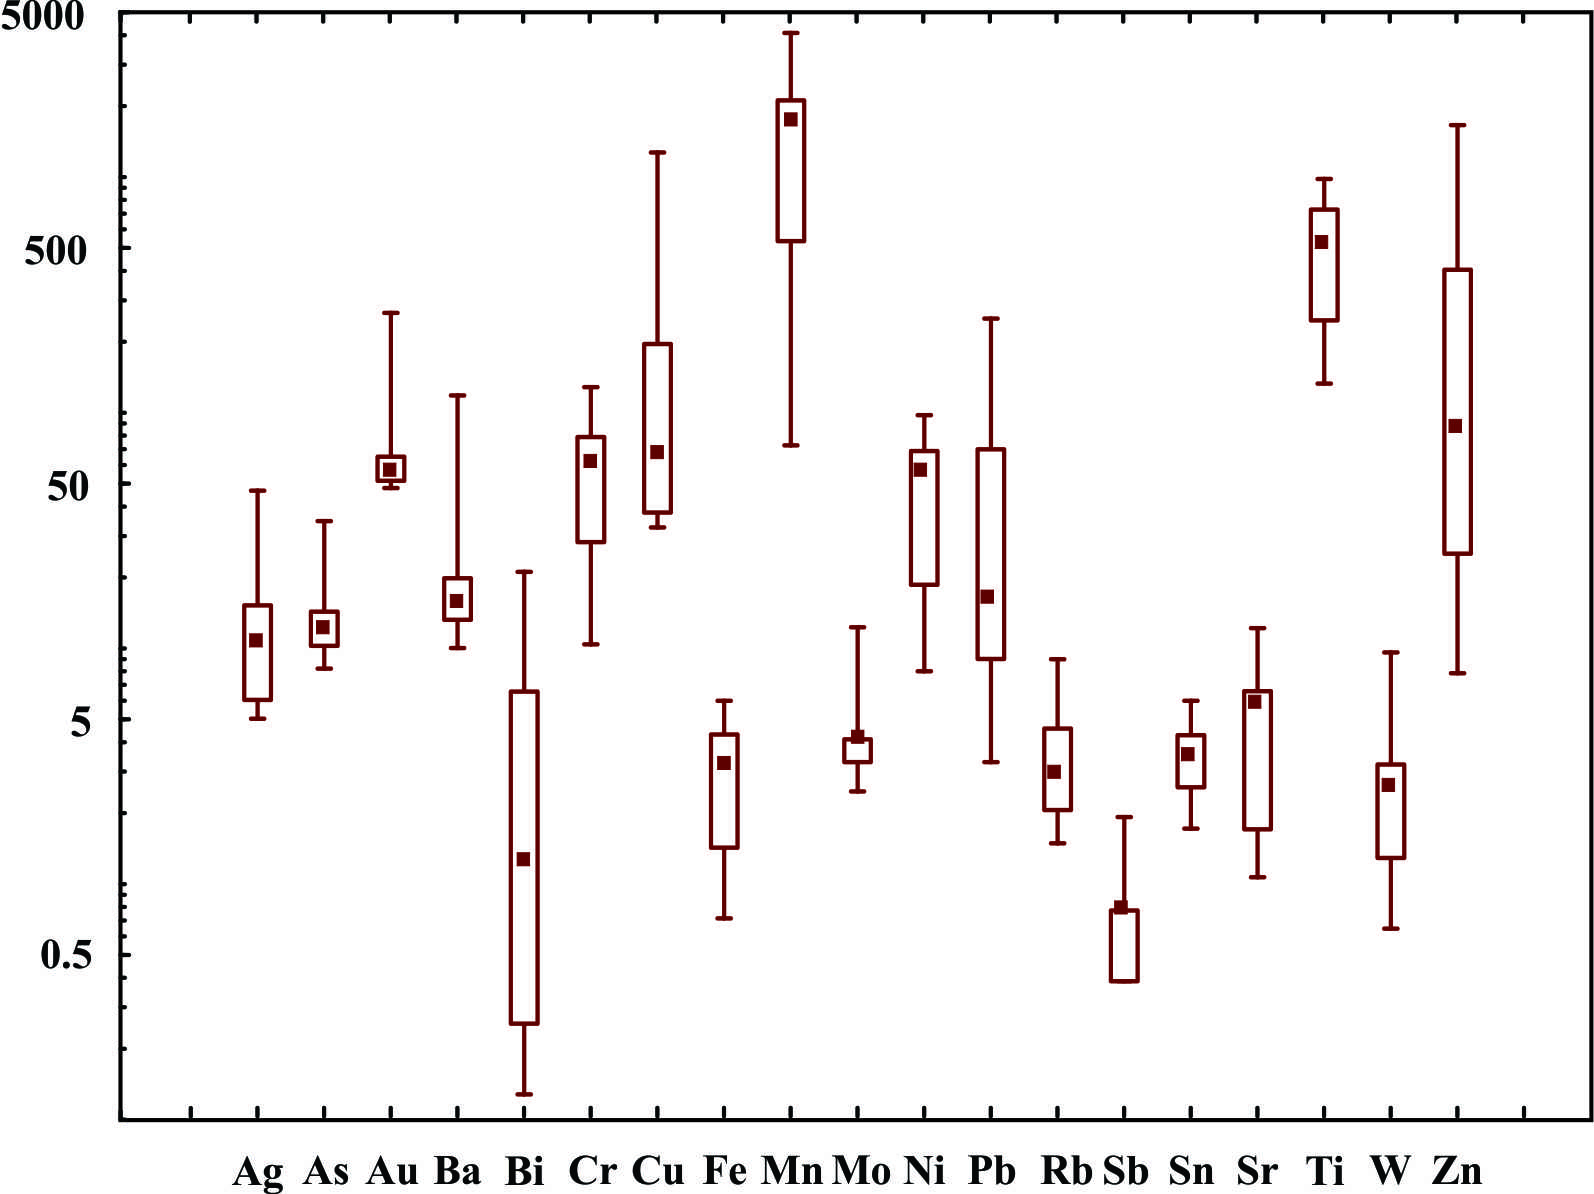
Fig.7.box-and-whisker diagram shows the minimum, lower quartile (Q1), median (Q2), upper quartile (Q3), and maximum values of 19 elements examined in the < 63 µm fraction of the Wadi Haimur stream sediments.
(All data in ppm except Ag and Au in ppb and Fe %)
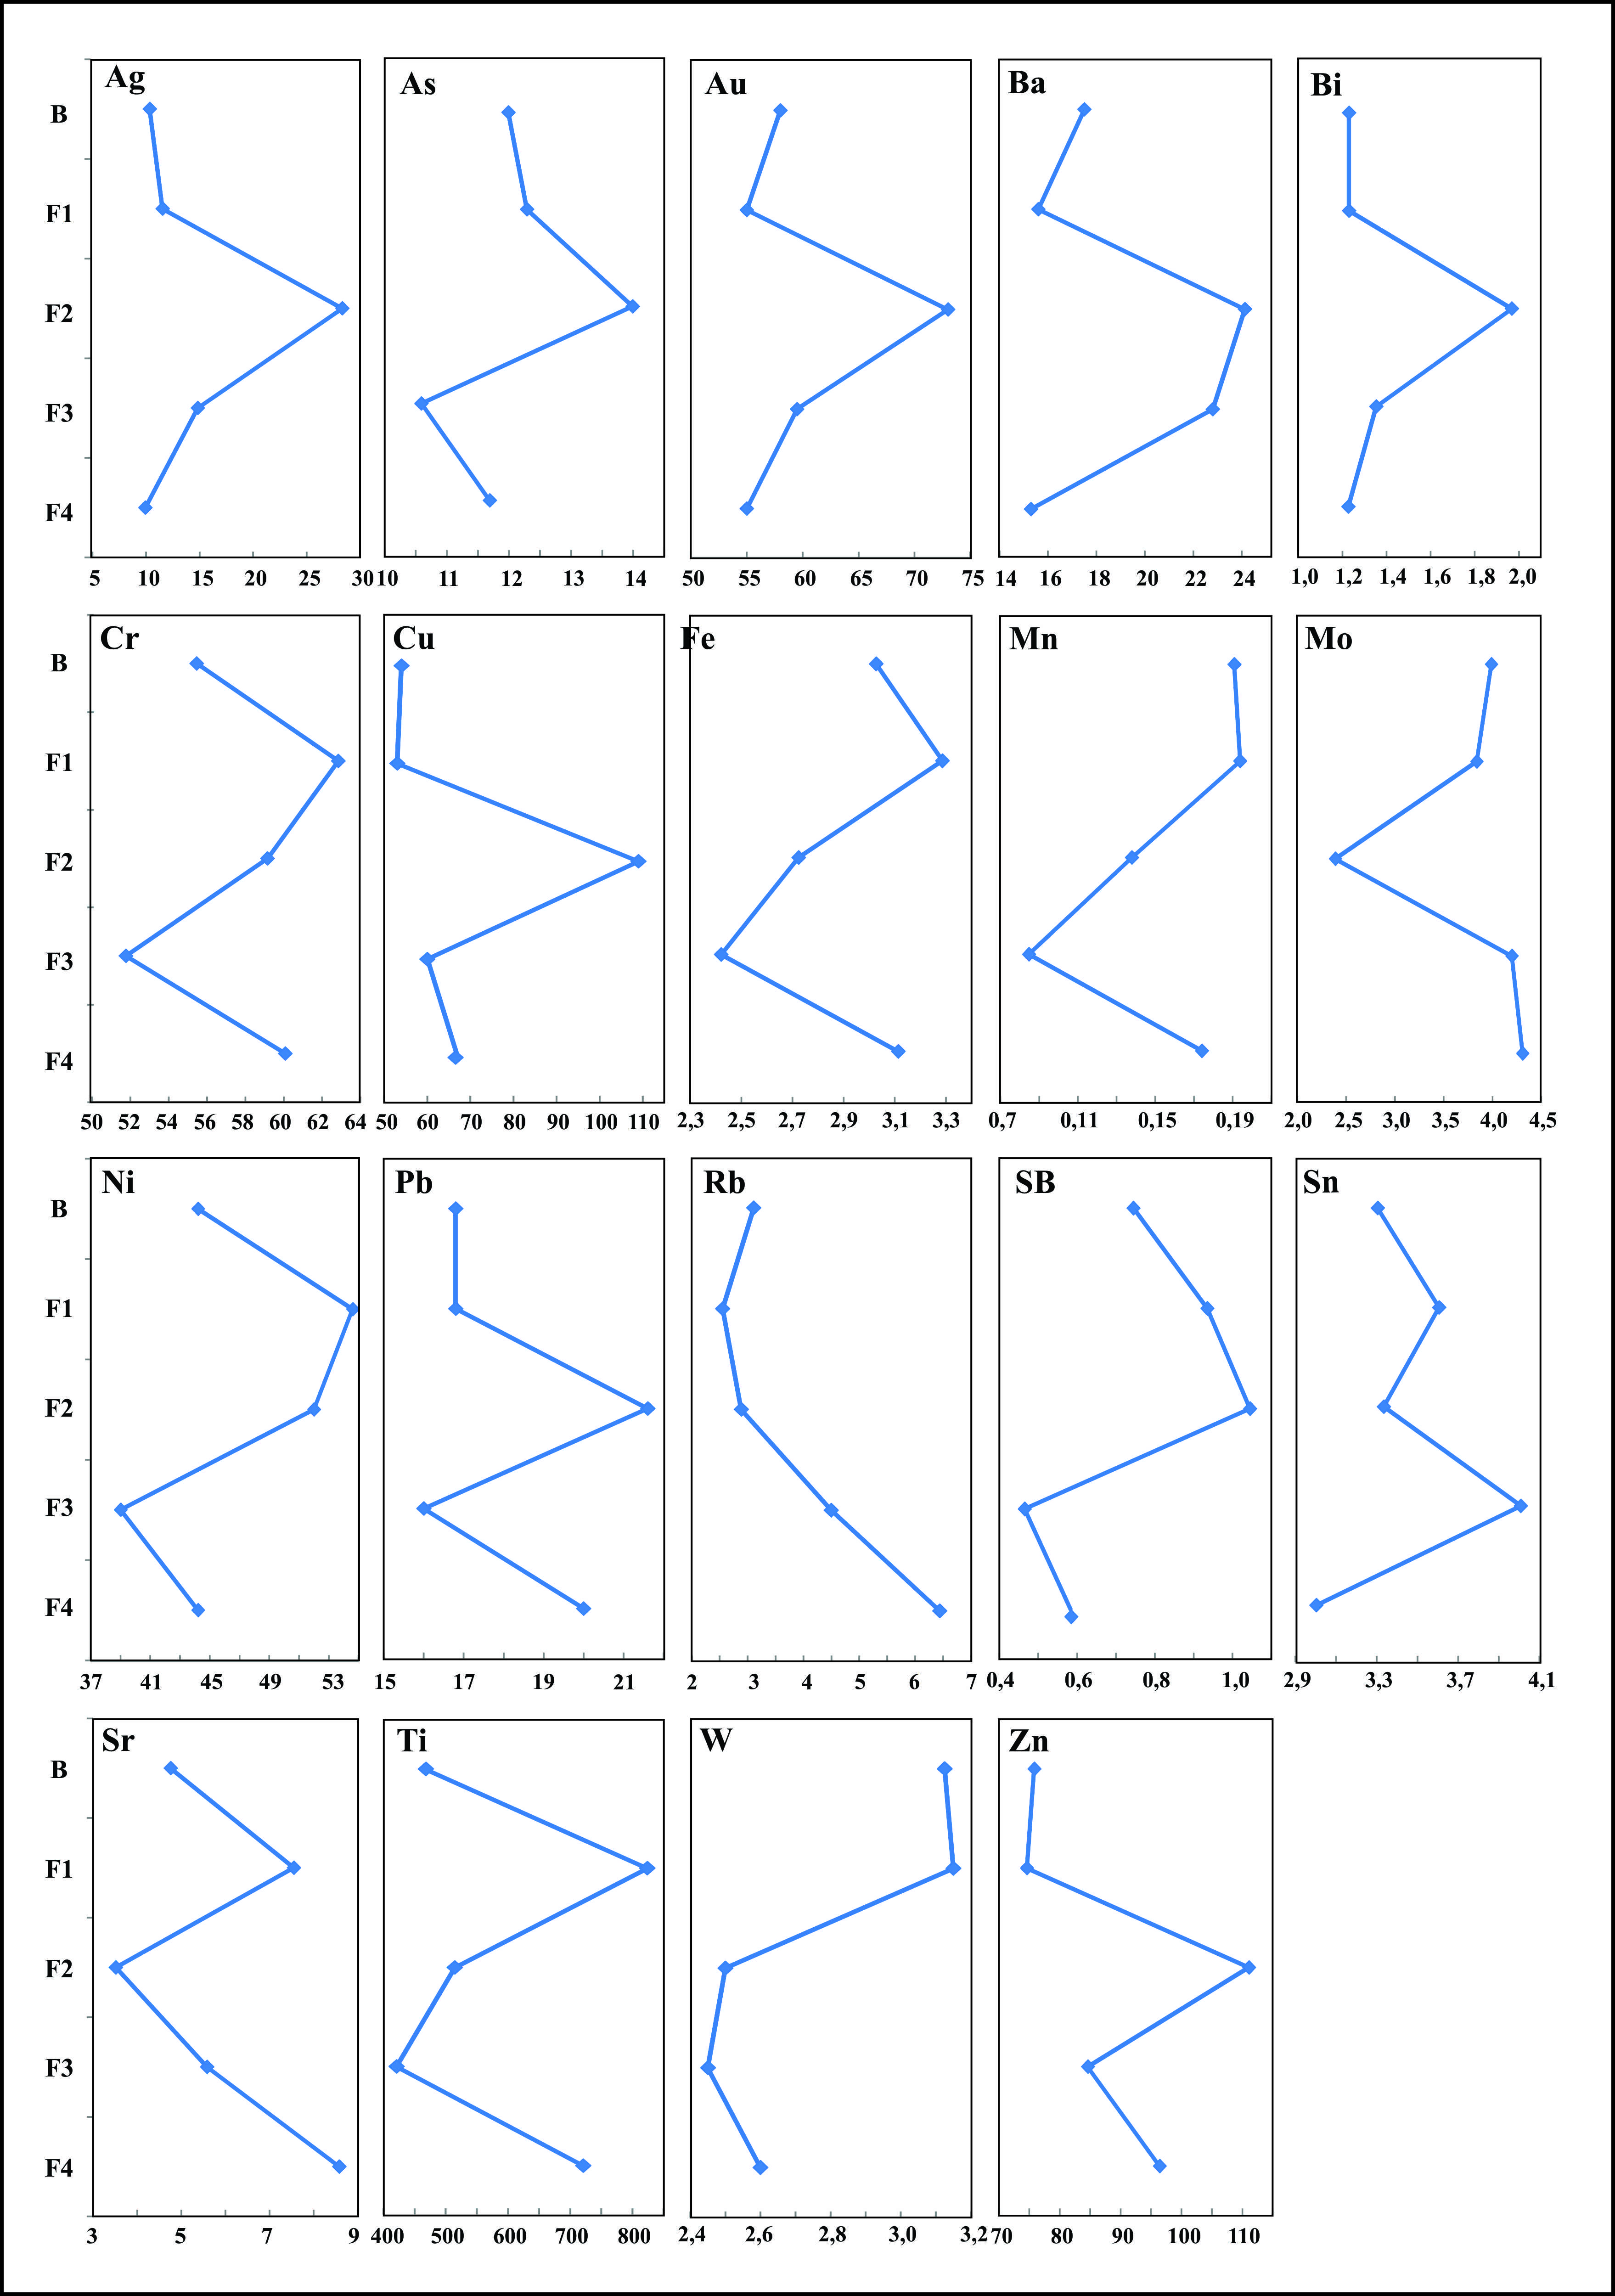
Fig. 8. Line plot shows the variation of trace element median concentrations of stream sediments with grain size. (All data in ppm except Ag, Au in ppb and Fe and Mn in %)
B=Bulk fraction (<4 mm), F1=Coarse sand (-2-0.5 mm); F2=Medium sand (-500+250 µm)
F3=Fine sand (-250+63 µm); F4=Silt/Clay (<63 µm)
Figures (3-7) show a significant difference of the median, minimum, percentile (are at 25th, 50th, and 75th) and maximum values for Au and associated elements in all grain size fractions. Generally, the results of median values indicate that 250-500 µm fraction has the highest concentration of Ag, As, Au, Ba, Bi, Cu, Pb, Sb and Zn which can attributed to Au-mineralization [16]. The lowest standard deviation values for Au were found in <63 µm and 250-500 µm fractions respectively indicates the narrow range of Au concentration in these fractions. Variance values of all the elements in all grain size fractions are clearly significantly different. In addition, we notice that, the maximum concentration of Cr, Fe, Mn, Ni Ti and W were found in the 0.5-2 mm fraction which are related to mafic minerals and fragments of the country rocks. Sn and Mo recorded the highest concentrations in the 250-63 µm fraction which suggested to contain high amounts of wind blown materials. Sn tends to form only a few independent minerals, of which cassiterite is the most important Sn ore, and is strongly resistant to weathering. Molybdenum is found in the feldspars and in the ferromagnesium minerals (biotite, amphibole, pyroxene). Substitution of Mo for Fe3+, Ti4+, Al3+ and possibly Si4+ is suggested. The silt/clay <63 µm fraction has the highest levels for both Sr and Rb which reflect the presence of clay minerals. Rubidium and Strontium, are major components of clay minerals in finer fractions [17]. This may explain the highest Rb and Sr concentration in this fraction.
As a general trend, we found most of studied elements show an elevated concentration levels toward the < 63 µm fraction except for Ag, Au, Ba, Bi and Sn. indicating that metals are associated with finer particles. Rose [24] stated that, most of the transition metals in stream sediments are usually show highly concentration in the finer size fractions. The higher metal concentrations in the finer fraction are generally due to an increase in specific surface area and to the surface properties of the clay minerals, or to increased concentrations of Fe and Mn oxide and hydroxide [15, 24]. Also, in arid regions it is shown that Cu, Pb and Zn has an increased abundance in the <70 µm fraction [1].
Distribution of size fractions:
Tables 1 gives a summary of grain size analysis for the whole sample (< 2 mm) and for the 2-0.5 mm, 500-250 µm, 250-63 µm and < 63 µm fractions. The dominant fractions in the stream sediments are the 2-0.5 mm (coarse sand), comprising about 60 % of the bulk sample. The intermediate 0.5-0.25 mm fractions makes up to about 32% whereas the fine fractions (250-63 and <63 µm) are less abundant (6 and 2% respectively). The statistical variation of the abundances of each size fraction are indicated as standard deviation in Table 1.
Table 1. Descriptive of weights of different size-fractions of the stream sediment samples
|
|
2-0.5 mm (g) |
500-250 µm (g) |
250-63 µm (g) |
<63 µm (g) |
|
Mean |
1866 |
951 |
178 |
71 |
|
Median |
1915 |
937 |
168 |
66 |
|
St.Dev. |
532 |
71 |
75 |
22 |
|
Minimum |
984 |
844 |
25 |
31 |
|
Maximum |
3084 |
1258 |
445 |
123 |
Grain size fractions-trace element relations
A purpose for examining grain-size distributions and trace element concentrations was attempt to identify a universally applicable grain-size range to be used to facilitate inter-sample comparisons and for exploration surveys. Recommendations for this range are broad and usually based on studies done in limited geographical areas or mineralized regions.
Multivariate data anlysis
In stream sediment data analysis, multivariate data analysis methods are employed in order to simultaneously determine detailed interrelationships and associations of variables not fully revealed by univariate methods, and by so doing, factors influencing the properties of stream sediments and the distribution of metals in it are fully established.
Correlation coe&#ffi;cients: For a better understanding of the relationships between element concentration and grain sizes, Pearson’s correlations coefficient were calculated and listed in Table 2 and Figure (9 A-E) with its significance levels. Correlation coefficients were found to be statistically significant at the 0.01 level of significance (table 2). Correlation coefficient analysis for the data set displays a variety of elements that form families or element associations. A detailed analysis of the correlation matrix exhibits Ag, As, Au and Sb in all fractions are closely related whereas Cu, Pb, Zn, W, Fe, Mn, Ti, Cr, Ni, Sr and Sn have almost the same behaviour. According to table (2) we found that Bi, Cr, Cu, Fe, Mn, Ni, Pb, Sn, Sr, Ti and Zn have a significant positive correlation with both 2-0.5 mm and < 63 μm fraction sizes and exhibit non-significant or even negative correlation with the other fractions. This behaviour improve what we mentioned before about the close association of these elements with mafic minerals and rock fragments of coarser fraction (2-0.5 mm) and their adsorption to clay minerals and coprecipitation with Mn and Fe hydroxides. In addition, we can see that Ag, As, Au and Sb have only a significant positive correlation with fraction 500-250 μm but exhibit non-significant correlation or even negatively correlation with other fractions. These results suggest their enhanced concentrations are not due to co-precipitation with Fe-Mn hydroxides but possibly due to mineralization. Au either may occur as discrete grains or incorporated within a host mineral. Generally, both of 2-0.5 mm and 250-63 µm fractions does not show highly significant correlation with Au and its pathfinders. The aeolian dilution was dominant in the <250 μm fraction as suggested from Ti/Zr ratios studies in arid areas [4; 11].
Table 2. Pearson linear correlation coefficient (r) matrix between the grain size fractions and the elements in the study area (log data). *=Probability: <0.01
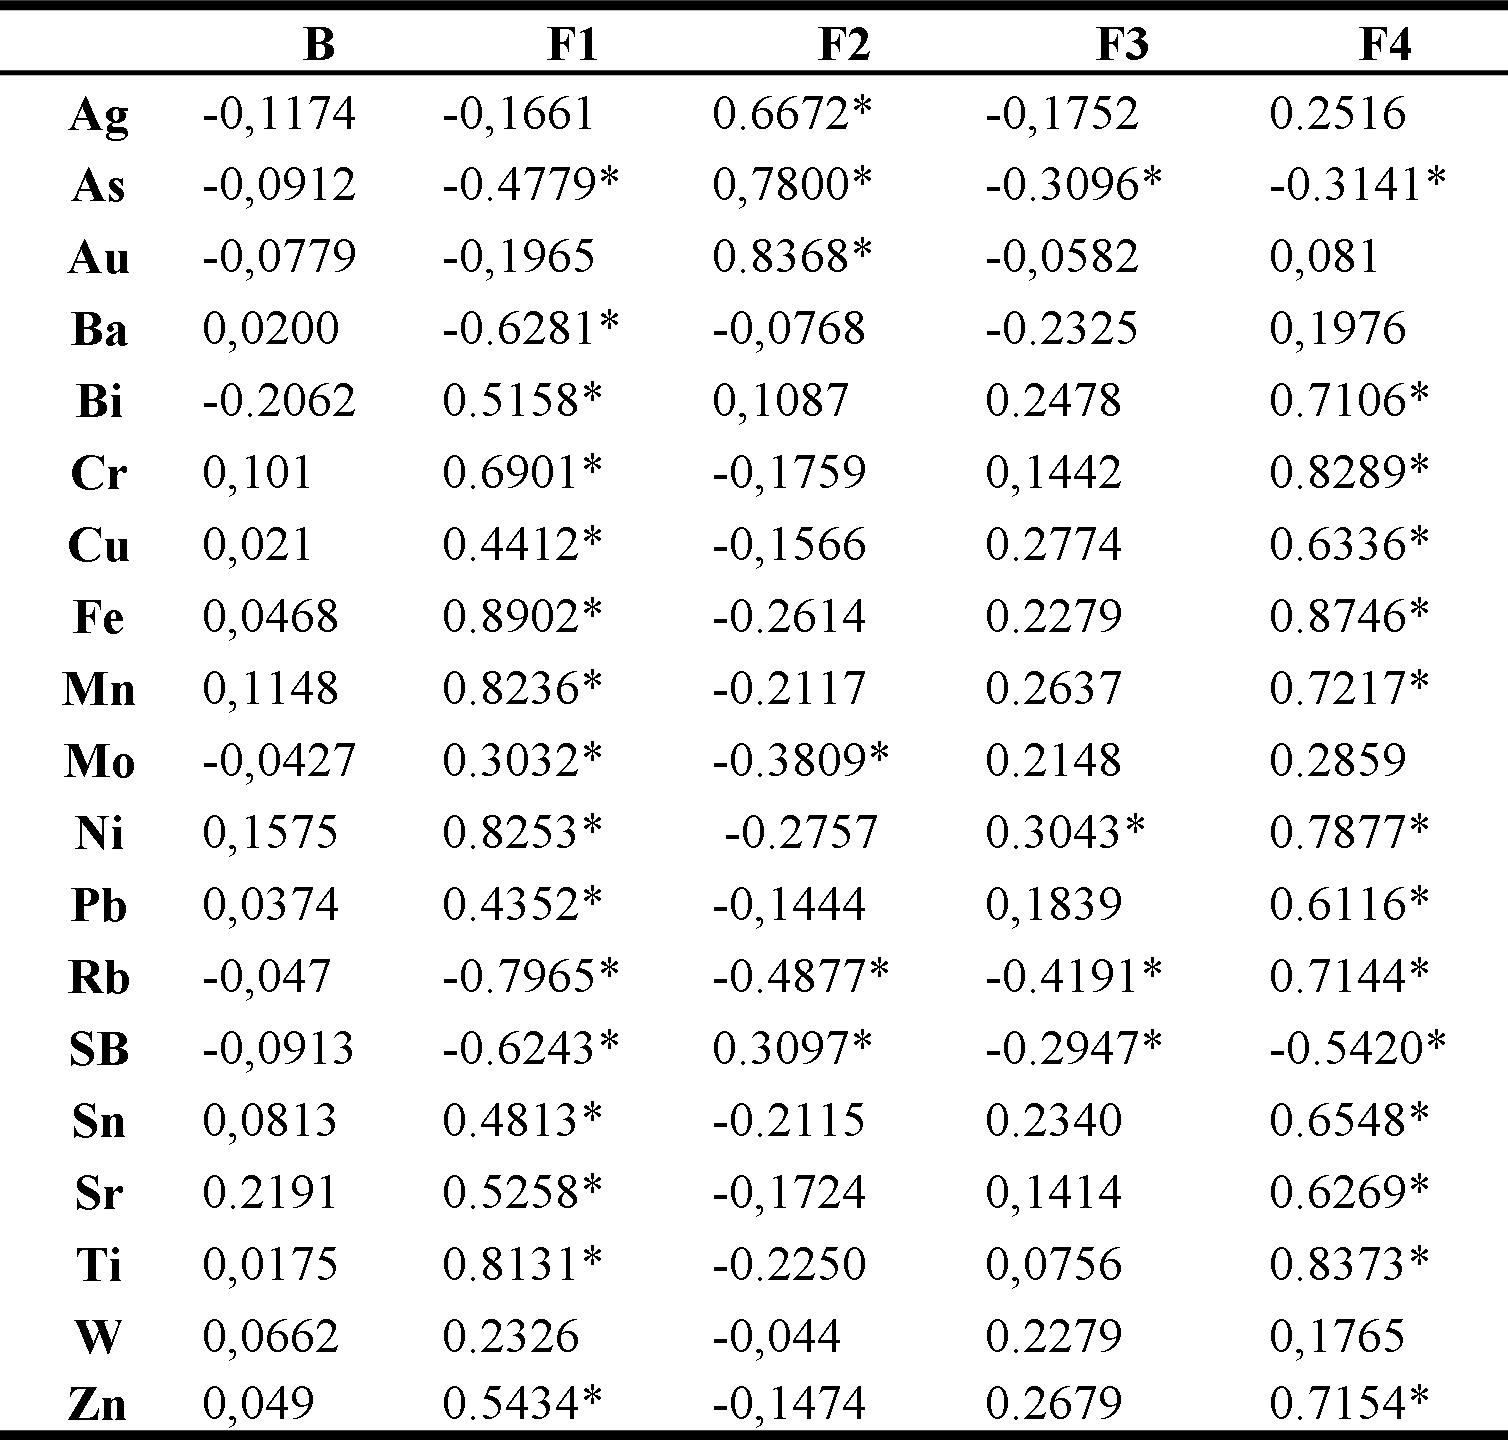
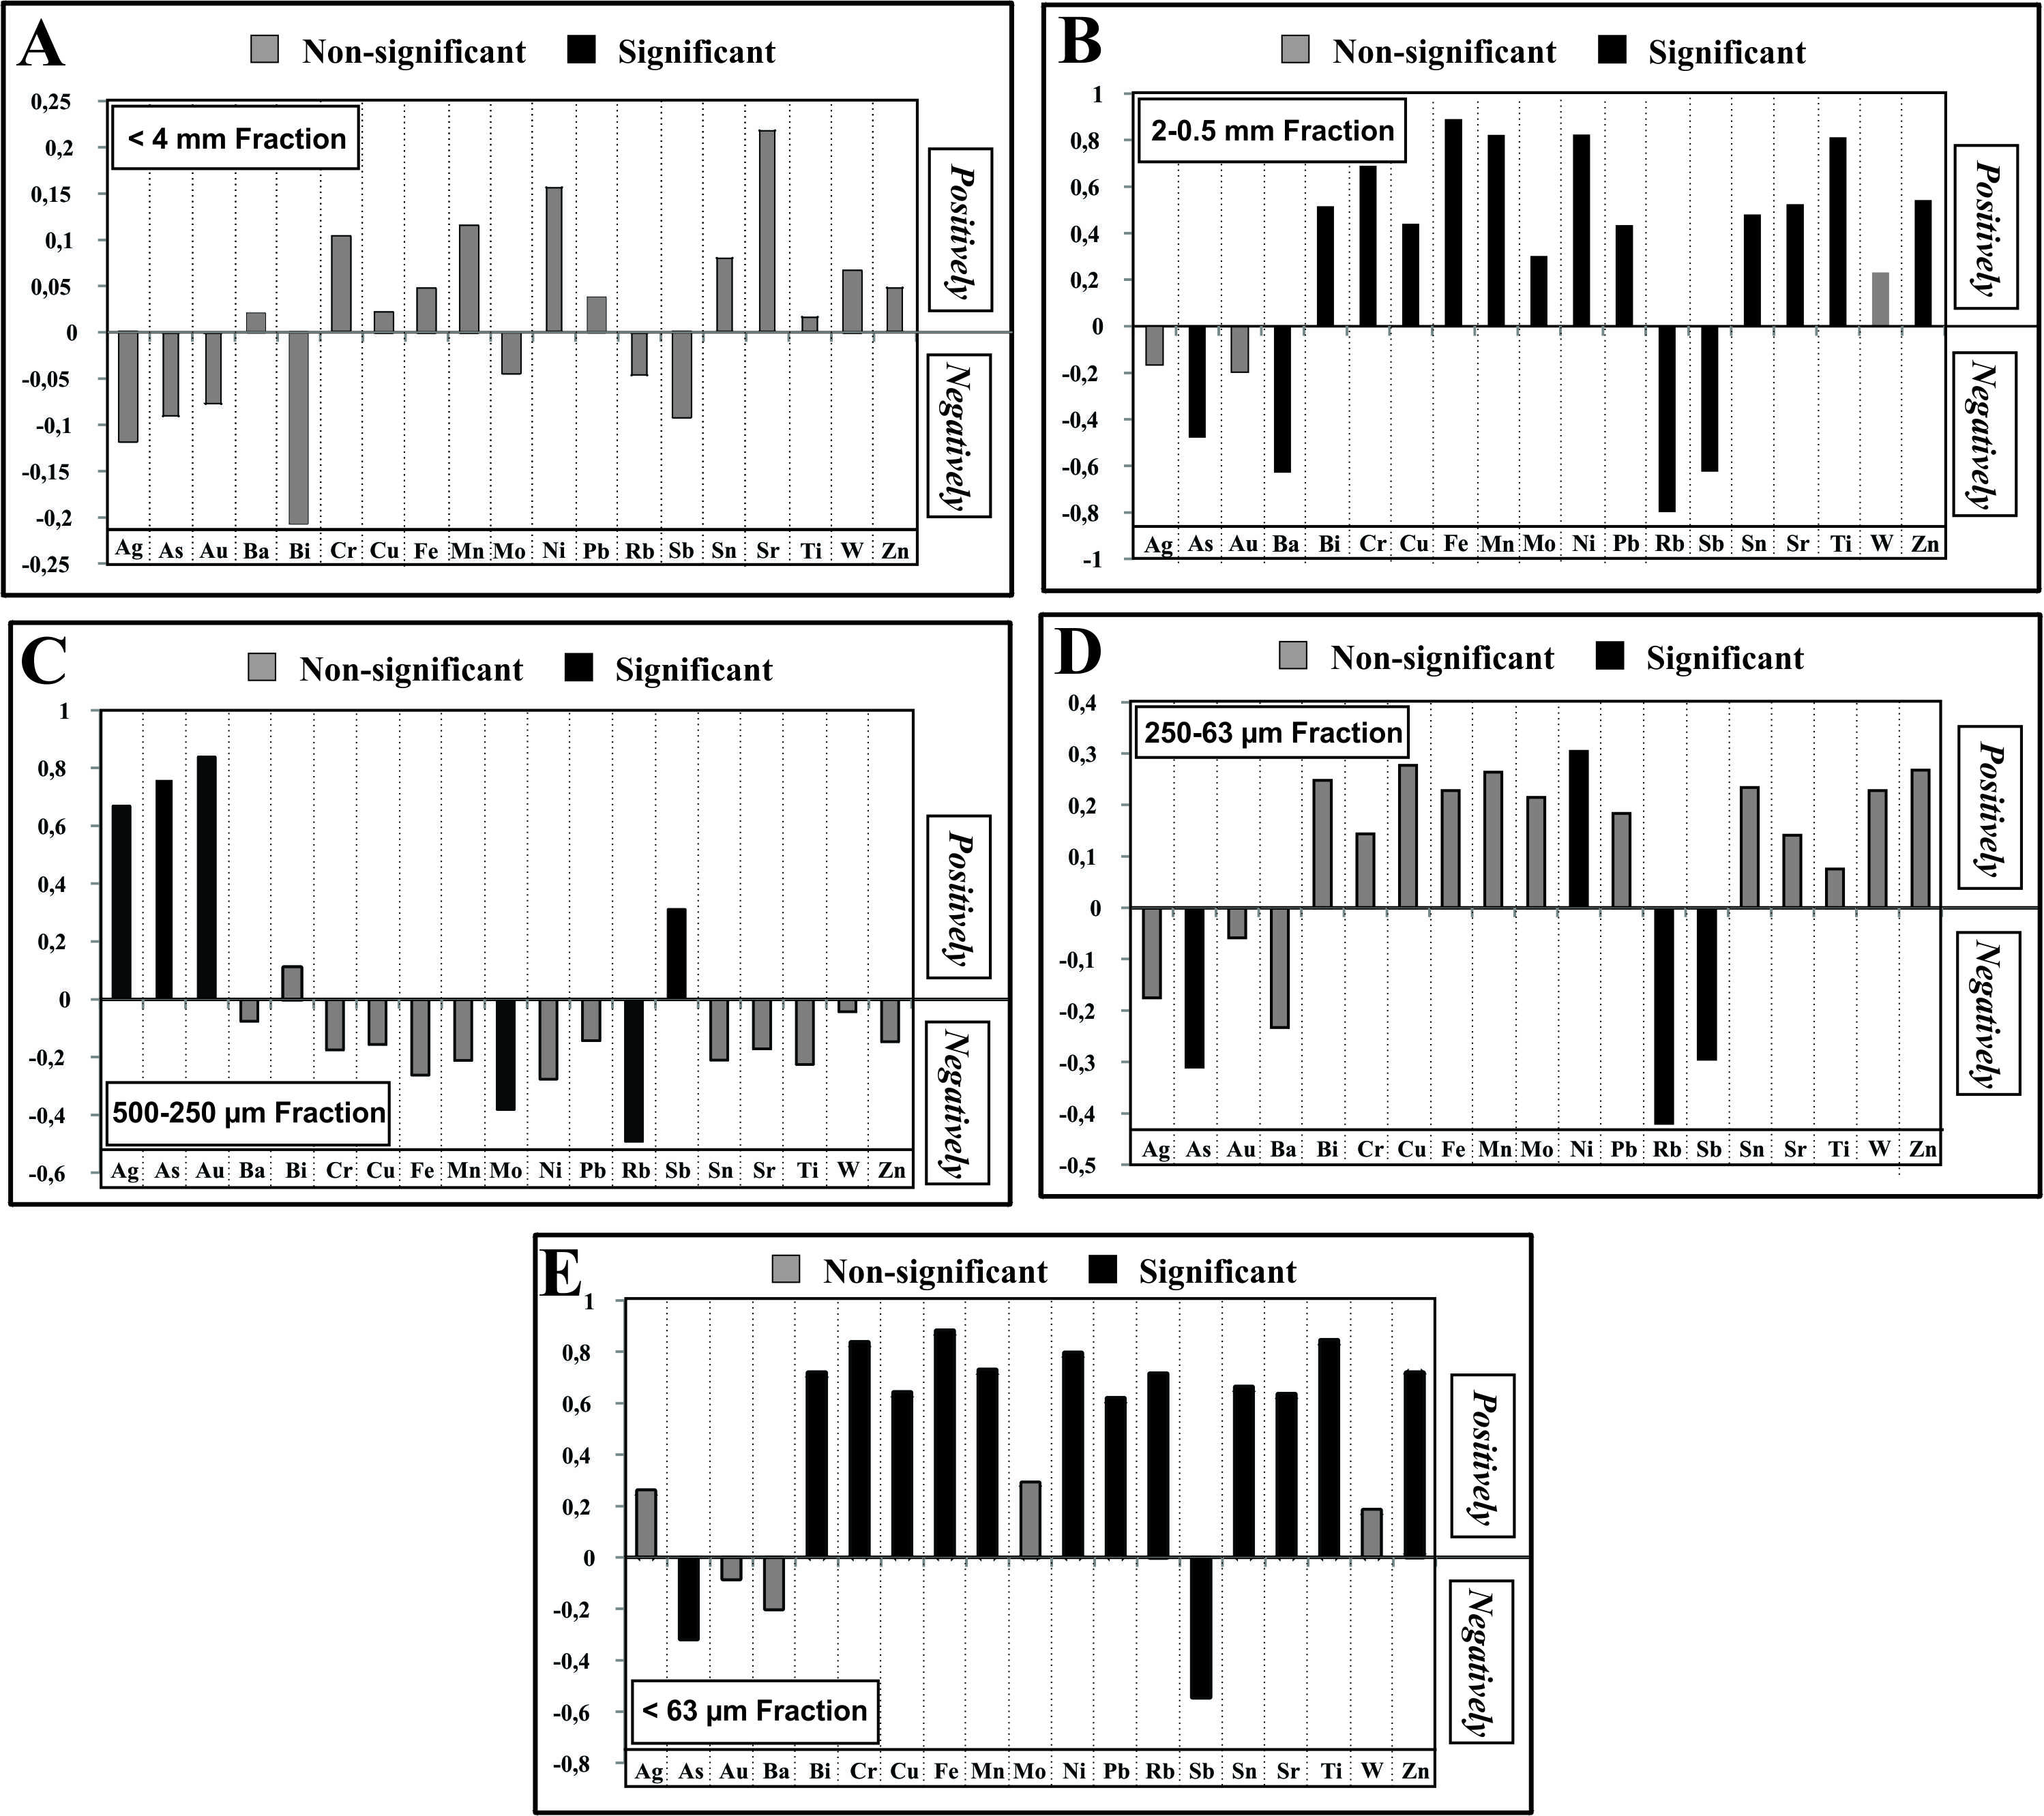
Figure 9. Bar graphs showing the correlation coefficients between the different fractions of the samples and 19 measured elements
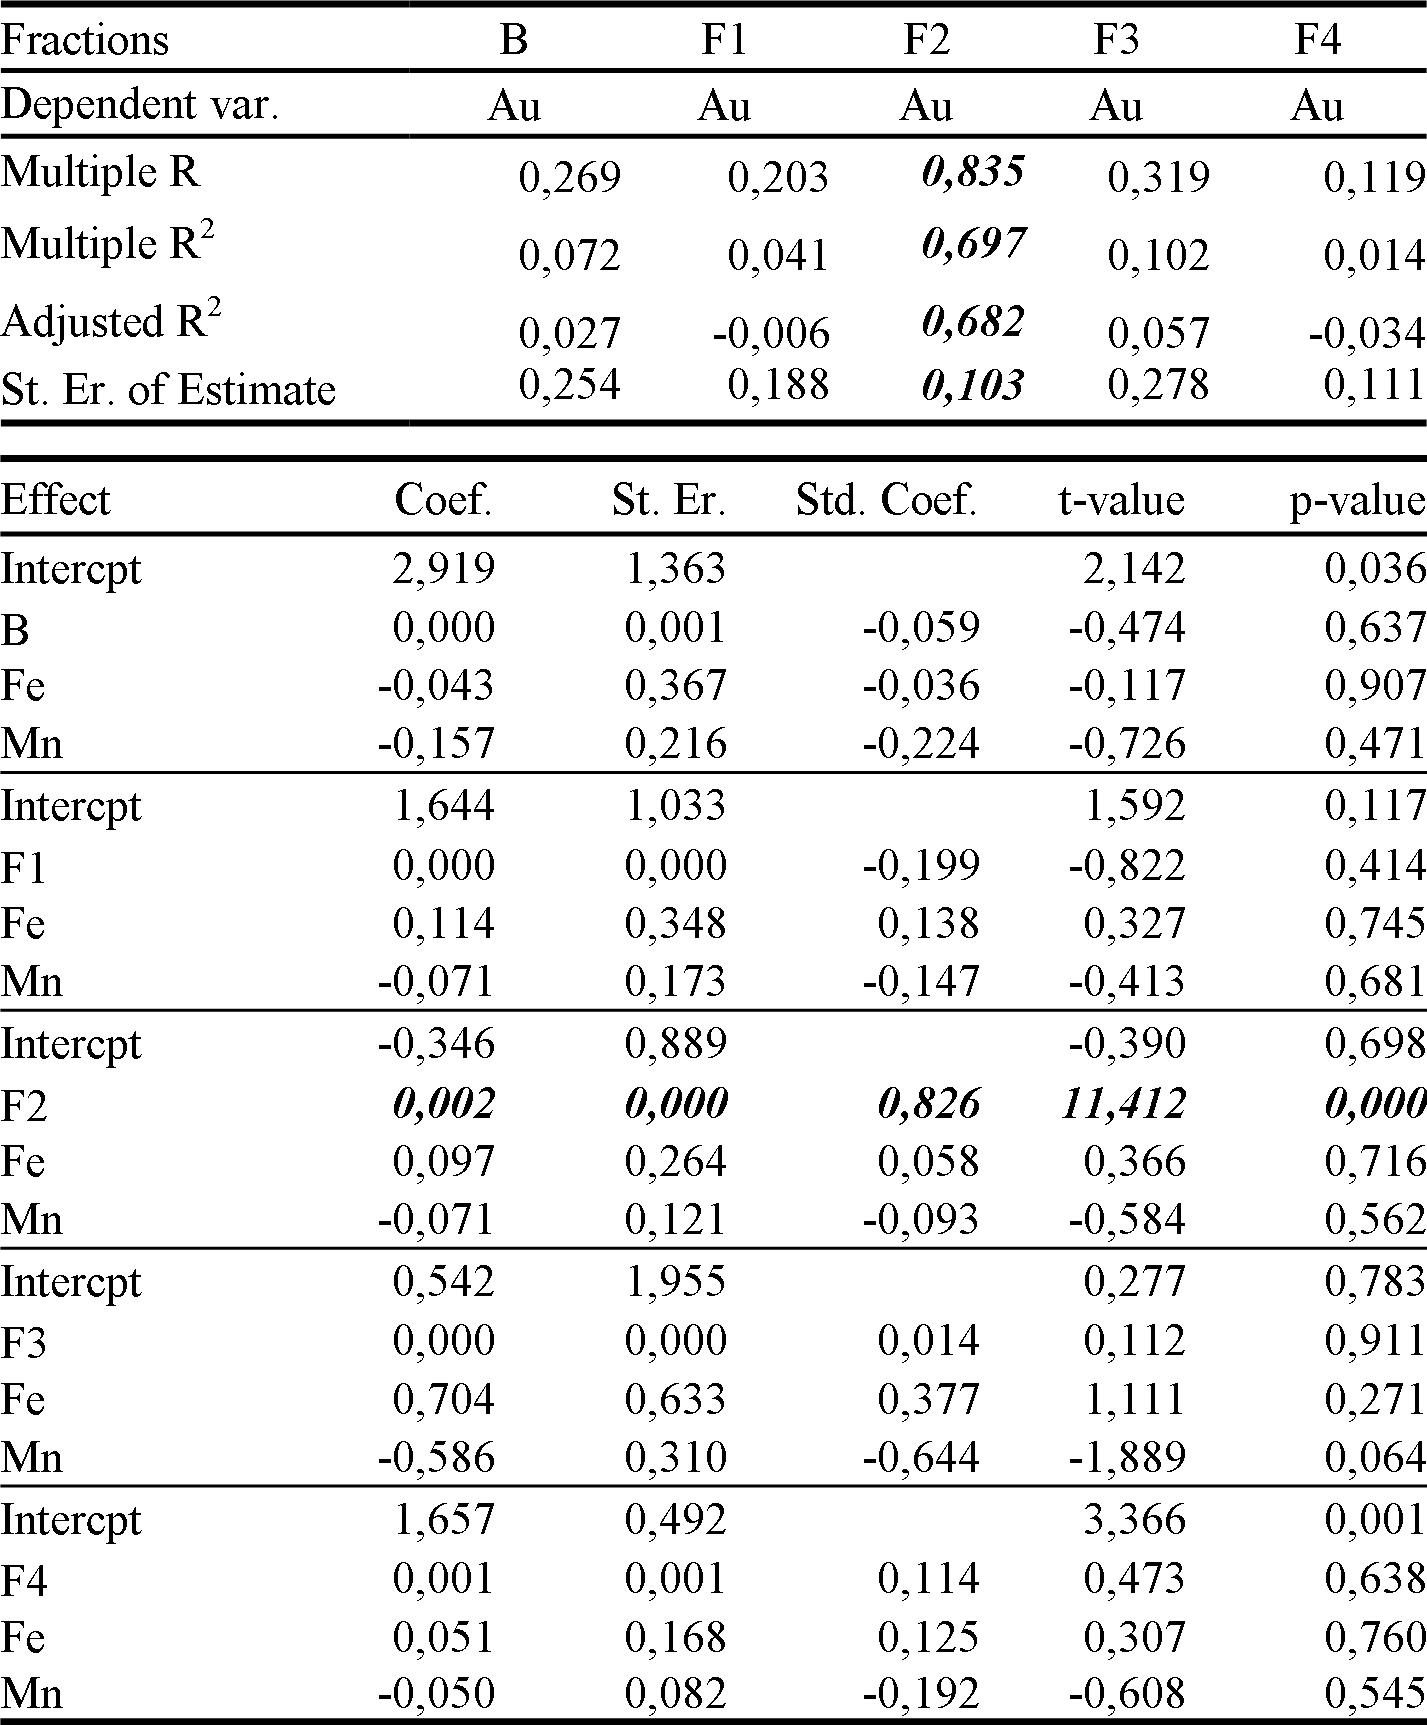
Multiple Regression analysis: The effects of grain size upon the Au distribution in stream sediment geochemistry are quantified by way of regression analysis and using as independent variables (1) weight, (2) Fe concentrations and (2) Mn concentrations for each fraction size [3, 6]. The effectiveness of the independent variables in explaining the variation of the dependent variables can be characterized using R2, which is the ratio of the sum of squares explained by regression to the total sum of squares [3].
Table 3 represents the results obtained from Multiple Regression Analysis for Au as a dependent variable against as independent variables to throw a light on the influence of the later variables on gold occurences and distribution. The calculated R2 value here indicates that the predictors (i.e. the independent variable) explain 69.7% of the variance of Au in 500-250 µm fraction. The p-value for the estimated coefficient of 500-250 µm fraction is 0.000 indicating it has an important influence on Au concentration. While the p-value for Fe and Mn concentrations are 0.716 and 0.562 respectively, indicating that they are not related to Au concentrations at a level of 0.05.
Table 3. Summary results from the Multible Regression Analysis
This study shows that element concentration levels significantly vary with grain size. On the basis of element concentration levels the 500-250 µm fraction is optimum for studying on Ag, As, Au, Ba, Bi, Cu, Pb, Sb and Zn. The coarse fraction 2-0.5 mm fraction is suitable for Cr, Fe, Mn, Ni Ti and W while the optimum fraction for Sn and Mo can be considered as 250-63 µm and for Rb and Sr it is the <63 µm fraction.
The highly positive significant correlation of Bi, Cr, Cu, Fe, Mn, Ni, Pb, Sn, Sr, Ti and Zn with both 2-0.5 mm and <63 µm size fractions are strongly influenced by the presence of hydrous Mn-Fe oxides. These suggest two concentrations of metals, one in the finest fraction, and a second in the coarse sand fraction. The latter can be explained as a result of the increasing prevalence of mafic minerals and also increasing thickness of Mn-Fe oxides coatings, with the oxides serving as a second collectors for these trace elements.
With the aid of multivariate analysis, we found that, Au is strongly influenced by presence of 500-250 µm fraction rather than presence of hydrous Mn-Fe oxides on sediment grains.
The coarser fraction (2-0.5 mm) contains fragments of primary rocks and weathering products (iron and manganese oxides). The finer fraction (<63 µm) comprises clay minerals and Fe-Mn oxide and hydroxides. The intermediate fraction 500-250 µm dominated by ore mineral grains. The fine sand fraction thought to be diluted by a windblown dust and comprise mixing of silicate and little ore-mineral grains (plagioclase, microcline, quartz, biotite, cassiterite and molybdenite).
No significant relationship between element concentration and morphology and climate of the study are could be observed.
References:
Beeson, R, 1984. The use of fine fraction of stream sediment in geochemical exploration in arid and semi arid terrain. J Geochem Exploration 22, 119-132.
Beeson, R., Herzberg, W. and Frick, A., 1974. Geochemical orientation studies of base metal occurrences in the north-western Cape Province. Ann. Geol. Surv. S. Afr., 10: 3--6.
Bonham–Carter, G.F., Rogers, P.J. and Ellwood, D.J., 1987. Catchment basin analysis applied to surficial geochemical data, Cobequid highlands, Nova Scotia. J. Geochem. Explor. 29, 259 – 278.
British Geological Survey. 1999. Rйsultats de l'йtude d'orientation et analyses chimiques des "Stream Sediments" dans le domaine de l'Anti-Atlas (Maroc). British Geological Survey Report prepared for the Moroccan Ministry of Mines and Energy, Rabat, Morocco.
Bugrov, V.A. (1974): On the geological operations carried out f rom June 1972 to June 1974. U.N. Development Program, Tech. Rep.
Carranza, E.J.M. and Hale M., 1997. A catchment basin approach to the analysis of reconnaissance geochemical – geological data from Albay province, Philippines. J. Geochem. Explor. 60, 157 – 171.
Chapman RP. 1976. Some Consequences of Applying Lognormal Theory to Pseudonormal Distributions, Discussion. J. Math. Geol. 8:209-214.
Darwish, M.A.G., 2004, Geochemical exploration for the gold in Haimur area, Wadi Allaqi, Southeastern Desert, Egypt: Ph.D. Thesis, Aswan Fac. Sci., South Valley Univ., Egypt,
Davis JC. 2002. Statistics and Data Analysis in Geology. 3RD Edition, John Wiley & Sons, Inc., New York.
Davy, R., Rossiter, A.R. and Wall, L.N., 1980. Stream sediments. J. Geochem. Explor., 12: 131--133.
Dickson, B.L., Scott, K.M. 1998. Recognition of aeolian soils of the Blayney district, NSW: implications for mineral exploration. Journal of Geochemical Exploration, Vol. 63, 237-251.
El Gaby, S.; List, F.K. and Tehrani, R.; 1988. Geology, evoulation and metallogenesis of the Pan-African belt in Egypt. In: El Ghaby, S and Greiling, R. O. (eds). The Pan African belt of NE Africa and adjacent areas. Earth Science and applications. Wiesbaden, Germany, Biewegn, pp.17-68.
Fletcher w.k., 1990. Dispersion and behaviour of gold in stream sediments; B.C. Ministry of energy, Mines and Petrolum Resources, Open File 1990-28
Fletcher, W.K. 1997. Stream sediment geochemistry in today’s exploration world. In Proceedings of Exploration 97: Forth Decennial International Conference on Mineral exploration editor A.G.Gubbins, pages 249-260.
Hale, M., Plant, J.A., 1994. Drainage geochemistry.In: Govett, G.J.S. (Ed.), Handbook of Exploration Geochemistry.Elsevier,Amsterdam volume 6.
Jordan,C.,Zhang,C.,Higgins,A.,2007. Using GIS and statistics to study in&#fl;uences of geology on probability features of surface soil geochemistry in Northern Ireland. Journal of Geochemical Exploration 93, 135-152.
KABATA-PENDIAS, A.; PENDIAS, H., 2001. Trace elements in soils. 3rd Ed. Boca Raton, London, New York, CRC Press. 413 pp.
Li Qing, Xi Xiaohuan, Ren Tianxiang, Zhao Yutao1, Che Guangjun, 1989. Geochemical exploration in the semiarid steppe terrain of eastern Inner Mongolia - a case history. Journal of Geochemical Exploration, Vol. 33, Issues 1-3, 27-46
McLaurin, A.N., 1978. Geochemical dispersion from the Gamsberg orebody, northwestern Cape, South Africa. J. Geochem. Explor., 10: 295--306.
Ottesen R.T. and Theobald P.K., 1994. Stream Sediments in Mineral Exploration”, in Drainage Geochemistry, Handbook of Exploration Geochemistry, vol. 6 (ed. G.J.S. Govett). Amsterdam: Elsevier, p. 147.
Reimann, C., and P. Filzmoser 2000. Normal and lognormal data distribution in geochemistry: Death of a myth. Consequences for the statistical treatment of geochemical and environmental data, Earth Environ. Sci., 39 (9), 1001–1014.
Reimann, C., P. Filzmoser, and R.G. Garrett. 2005. Background and threshold: Critical comparison of methods of determination. S cience of the Total E nvironment 346, no. 1-3: 1-16.
Rock NMS. 1988. Numerical Geology. Springer-Verlag, Berlin.
Rose A.W., Hawkes H.E., and Webb J.S., 1979. Geochemistry in Mineral Exploration, (2nd ed.). London: Academic Press, p. 657.
Salminen, R., and T. Tarvainen. 1997. The problem of defining geochemical baselines. A case study of selected elements and geological materials in Finland. Journal of Geochemical Exploration 60, no. 1: 91- 98.
