


This article describes a formalized scheme of representation sets of tests and test results suitable for subsequent analysis of reliability and discriminative tests. A distinctive feature of this scheme is the methodology for the submission of correct answers {Ak,j}, ![]() , on the task Tk as a fuzzy set Rk c membership function ωk(Ak,j), which allows for test items with several options of correct answers, with each answer has its own «level of correctness», as well as to calculate the accumulated points are not on the criterion of» correct answer — the answer is wrong, «and depending on the choice of a particular variant of the answer.
, on the task Tk as a fuzzy set Rk c membership function ωk(Ak,j), which allows for test items with several options of correct answers, with each answer has its own «level of correctness», as well as to calculate the accumulated points are not on the criterion of» correct answer — the answer is wrong, «and depending on the choice of a particular variant of the answer.
Keywords: complexity test task, discriminative test task,dispersion, knowledge assessment systems, Pearson correlation coefficient, «parallel» tests, specific test items, test
Formulation of the problem
In recent years, widespread knowledge assessment systems based on the testing process. This article describes a formalized scheme of representation sets of tests and test results suitable for subsequent analysis of reliability and discriminative tests. Following this formal scheme, you can design a knowledge assessment system, where information about the questions, answers and test results stored in a relational database.
Suppose we have some set of tests {Tk}, ![]() , where n — total number of jobs. For each task Tk we have a lot of options available responses {Ak,j},
, where n — total number of jobs. For each task Tk we have a lot of options available responses {Ak,j}, ![]() , where mk — the number of options for setting Tk. We represent the set of correct answers to the problem of Tk as a fuzzy set with the function Rk toiletries, ωk,max=max(ωk(Ak,j)) — the height of the set Rk. In the case where ωk = {0,1}, will deal with «normal» test task with two types of responses: true and false.
, where mk — the number of options for setting Tk. We represent the set of correct answers to the problem of Tk as a fuzzy set with the function Rk toiletries, ωk,max=max(ωk(Ak,j)) — the height of the set Rk. In the case where ωk = {0,1}, will deal with «normal» test task with two types of responses: true and false.
Analysis of test tasks
The simplest test analysis begins with the calculation of correct answers on a specific task [1]. Let Sk — Ak response options, j on the task of the Tk, which is considered the best test or Sk=Шif the test found that no one answer is not correct. Designating Pk for the total number of attempts to answer a task Tk, we can calculate the two values:
 (1)
(1)
 (2)
(2)
We call xk,1 — Information ratio of correct answers to the task Tk, xk,1 — wrong answers coefficient data. If ωk, j = {0,1}, then these values will denote the number of correct responses and incorrect data, respectively. To simplify further calculations normalize Rk. This is possible according to the assumption about the limited function ωk accessories. We make the change
![]() (3)
(3)
![]() (4)
(4)
Designating Nk= xk,1+ xk,2, we can compute the two important characteristics — a measure of correct answers yk,1= xk,1/Nkand the measure of wrong answers yk,2= xk,2/Nk. The product of these values is regarded as the standard measure of variation — variance Tk job:
dk=yk,1 yk,2(5)
Dispersions Tk test task in conjunction with the values of хk,1and хk,2 are an indication of the complexity and discriminative test task [5]. By setting means discriminative ability to separate subjects with a high score on the test than those who received a low score. [3,4] When building quality systems and analysis of test items, be aware that dk depends on the value Pk (the higher the number of attempts to answer to the Tk task, the more accurate the variance). Thus, it is advisable to keep a history of changes in dispersion or storage design results table so that there is the possibility of obtaining dk values in the break time or the number of attempts to solve this task.
Tests
But the analysis of specific test items is not an end in itself, most of us are interested in the analysis of a set of tests to be submitted as a single whole. So we arrive at the definition of the test. We call the test ![]() - a set of tests
- a set of tests ![]() , which
, which ![]() - membership function test tasks for the test
- membership function test tasks for the test ![]() , which has the domain of the set {Tk} and takes two values: 1 — if the task Tk is included in the test
, which has the domain of the set {Tk} and takes two values: 1 — if the task Tk is included in the test ![]() and 0 — otherwise.
and 0 — otherwise.
Based on this scheme, the formal submission of tests to draw some conclusions about ways to store information in a knowledge assessment systems.
Membership functions ![]() can be implemented as a table with two fields, the first of which — the identifier
can be implemented as a table with two fields, the first of which — the identifier ![]() , and the second — the identifier T k. The partition table contains information about a variety of tests
, and the second — the identifier T k. The partition table contains information about a variety of tests ![]() , a table of test items and table relationships (affiliation) of tests to specific tests, we gain the ability to arbitrarily change the size of the test (number of members of his test items), as well as not increasing significantly the size of the base to use one test task in different tests.
, a table of test items and table relationships (affiliation) of tests to specific tests, we gain the ability to arbitrarily change the size of the test (number of members of his test items), as well as not increasing significantly the size of the base to use one test task in different tests.
Let us more detail on tests of reliability analysis. The test is called reliable if it enables the same results for each test by repeated testing [2]. We can say that it is absolutely reliable test exists, moreover, repeated testing for one sample test irrationally. Therefore, we shall mean by reliability test of its ability to show similar results to close at the level of the test samples. The most common methods for determining the reliability of — correlating the two «parallel» tests, designed to measure the same properties [1], or correlating the results of testing using a single test on a sample of subjects close.
Here is an example of calculating the Pearson correlation coefficient for the two «parallel» tests for a sample of subjects {Xl},
 , (6)
, (6)
Where,
 ,
,  ,
, 
 .
.
As for calculating the number of indicators used by the history of the test, it is clear that the results must be stored. This gives us the opportunity at any time to provide information about the past to carry out testing and appeal.
This scheme provides a more flexible system implementation exhibiting total score of the test [5]. Let ![]() — scores that can get the test, selecting in response to the task Tk this option Ak,s response, that
— scores that can get the test, selecting in response to the task Tk this option Ak,s response, that ![]() . Then it becomes possible to calculate the score obtained by selecting the answer Ak,i at task Tk, by the formula:
. Then it becomes possible to calculate the score obtained by selecting the answer Ak,i at task Tk, by the formula:
![]() . (7)
. (7)
However, this is not the only method for calculating the score that can be implemented within this model.
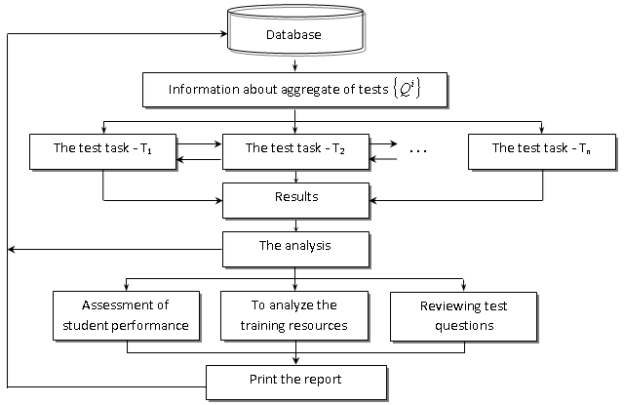
Fig. 1. Structure of the software of virtual control of knowledge
Conclusion
As part of this scheme is implemented fairly broad class of tests with closed-choice questions. The system is flexible enough that makes it universal. Calculation of numerical characteristics of the test, despite the seeming awkwardness and easily algorithmizationing.
System testing Virtual Testing System, is used as an Access database data warehouse was built on the basis of this model.
References:
- Антонов Ю. С. Хохлов А. М. Тестирование (теория и практика). Якутск, 2000.
- Kovalenko O. Evaluation of E-Learning. Deployment Scale OECD Publishing 2013.-pg134.
- Минин М. Г. Диагностика качества знаний и компьютерные технологии обучения. Томск: Изд-во ТГПУ, 2000.
- Hrabovskyi Yevhen. Diagnosis of the quality of knowledge and computer technology training. Journal of Communication and Computer.
- Malte Lenz, Johan Rhodin. Reliability theory of complex systems. SE-581 83 Linköping, Sweden 2011. –pg 118.
